HW+ hiring

Eric Hill, an Atlanta real estate agent representing a nationwide homebuilder, had a plan to help more than 100 homebuyers get mortgages. The problem: They did not qualify for the loans. 

Hill’s scheme, also enabled by a group of co-conspirators, caught up with him, in part because many of the loans started going south. In the end, some $850,000 in claims had to be paid on defaulted government-backed mortgages insured by the Federal Housing Administration (FHA). 

Hill instructed the homebuyers on how to game the system by submitting fraudulent asset, income and employment information on loan applications. He later found himself the target of a federal investigation that alleged the criminal conspiracy he engaged in resulted in more than $21 million in fraudulent mortgage loans being originated, many insured by the FHA. 

Hill also was accused of defrauding his employer out of $480,000 in sales commissions. 

“Eric Hill engaged in premeditated criminal acts with the sole purpose of enriching himself, without regard for millions of American homebuyers who rely on federal housing programs to insure their mortgages,” Wyatt Achord, special agent in charge with the Department of Housing and Urban Development (HUD) Office of Inspector General, said in a U.S. Department of Justice (DOJ) statement released on the case. “His fraudulent actions strike not only at the fiscal integrity of the FHA, but also our neighbors and communities who are victims of these schemes.” 

Hill, 52, and nearly a dozen co-conspirators, eventually were convicted and sentenced for their crimes. In Hill’s case, he was sentenced this past January to two-and-a-half years in federal prison to be followed by three years of supervised release. 

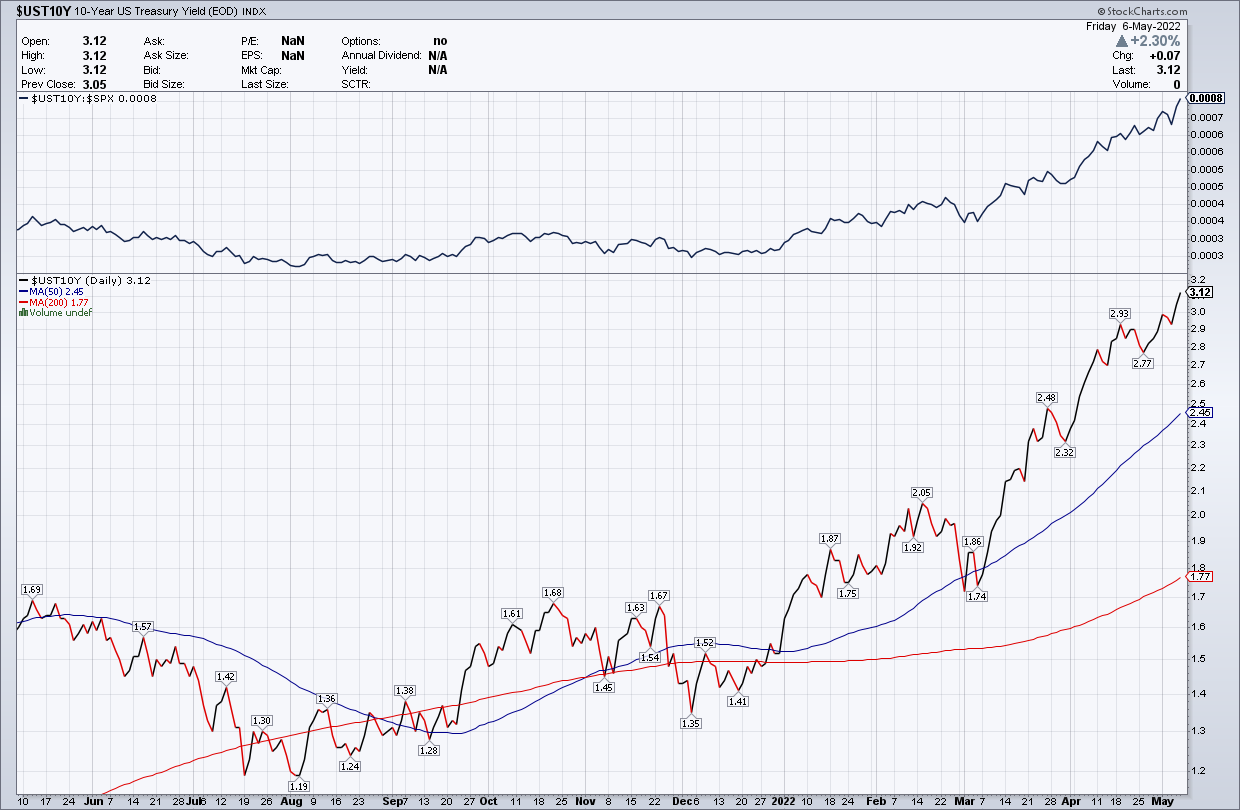
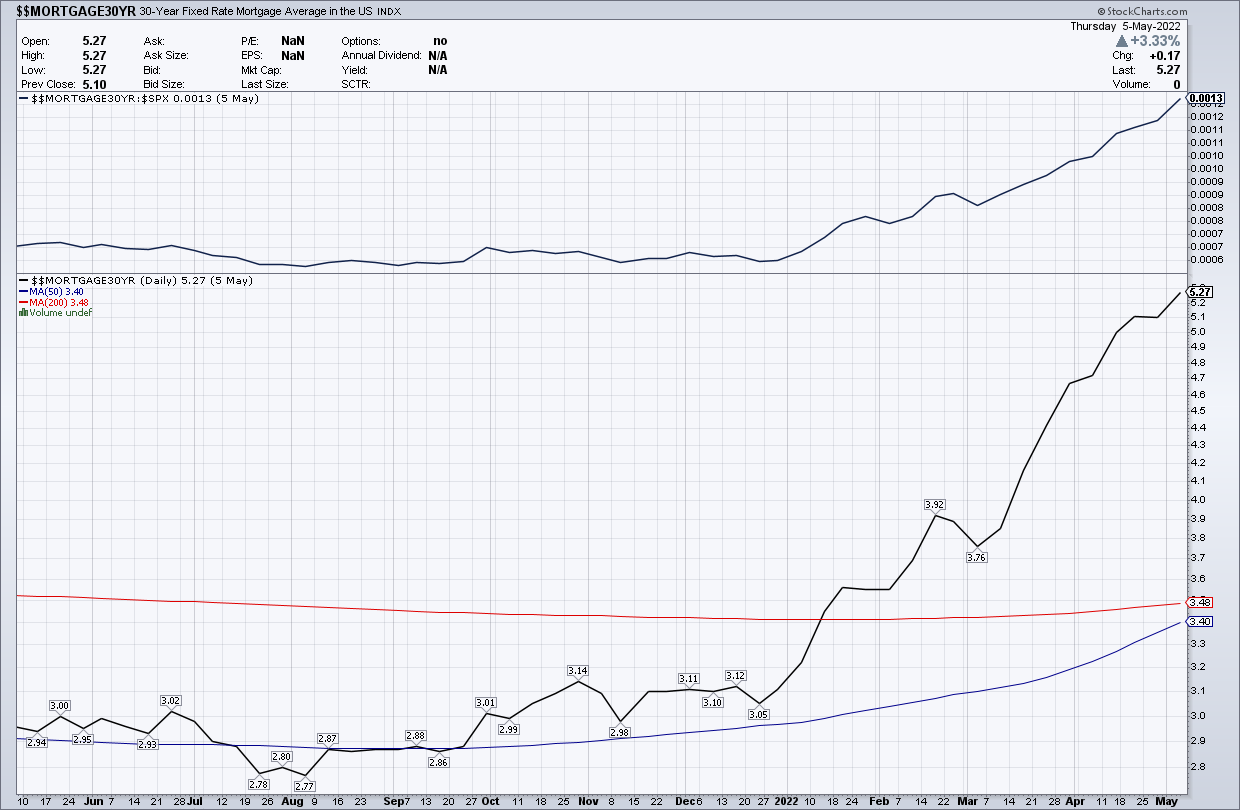
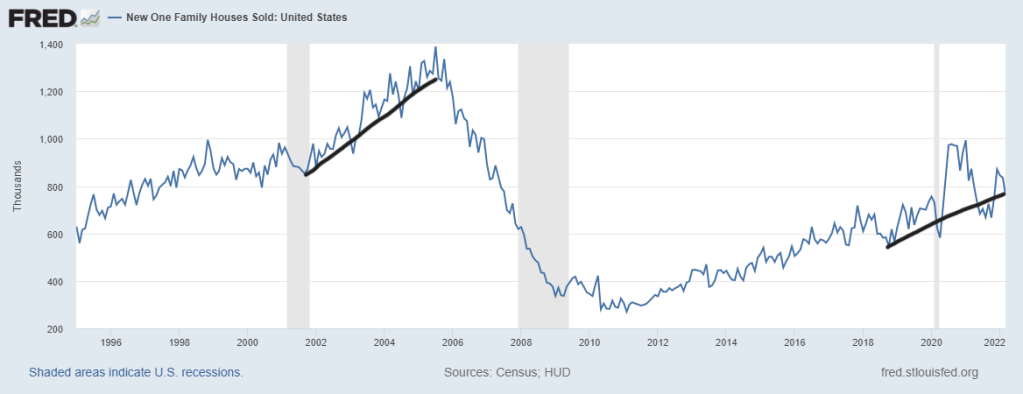
The Hill case is not a common occurrence in the world of housing finance, but it is far from rare. As the housing market enters a purchase-market cycle sparked by rising mortgage rates that have killed off a long-running refinance boom, we can expect to see mortgage-fraud schemes proliferate, industry experts say.

“The main drivers of the increase in fraud risk are the lower volumes of rate-term refinances and higher share of mortgages for the purchase of a home,” wrote Molly Boesel, an economist with CoreLogicin an article summarizing the findings of the firm’s annual Mortgage Fraud Report. “Purchase transactions have higher fraud risk than refinances. 

“In a purchase, there are more parties involved, more commissions, and more motives to ‘make the deal work.’” 

According to Boesel, CoreLogic estimates that the current overall mortgage-application fraud rate is at about 1 in 120 loans. For purchase-only loans, that ratio tightens to 1 in 90 loans. “It becomes a more concerning 1 in 23 if we only look at investment [property] purchases,” she added.

The extent of the mortgage-fraud problem and its national reach can be gleaned from DOJ press releases gathered from across the country. A website tracking some of those cases, the Mortgage Fraud Blog, highlights 10 federal cases from March, April and early May. All were winding their way through the federal court system — with defendants facing Indictments, arraignments, plea hearings or sentencing for mortgage-related fraud. 

Following are some of the DOJ presser headlines for those cases and links to the official releases describing the charges.

CoreLogic’s most recent quarterly fraud report showed that its Application Fraud Risk Index jumped by 10.4% in the fourth quarter of 2021, compared to the prior quarter — from 125 to 138. Year over year as of Q4 of last year, the index was up 26.7% — from 109 in Q4 2020.

Rising rates slowed the rate-term refinance train in the fourth quarter of last year, according to the CoreLogic report, moving the market toward purchase loans — and increased mortgage-fraud risks. 

In fact, rate locks for rate-and-term refinances were down 89.2% year over year as of April and 36.4% month over month. Likewise, cash-out refinance rate locks were down 31.1% over the month of April and 51.7% from a year earlier, according to a recent report by Mortgage Capital Trading Inc. Purchase rate locks, by contrast, were up 2.2% month over month in April and 7.55% from a year earlier.

The 10 major metro areas where fraud risk was highest as of the fourth quarter of 2021, according to the CoreLogic report, were Las Vegas; San Jose, California; Miami/Fort Lauderdale; Los Angeles; New York/Newark; San Francisco/Oakland; New Orleans; San Diego; Austin, Texas; and Tampa/St. Petersburg.

Scott McNulla, a senior director overseeing regulatory compliance at loan due-diligence firm SitusAMC, said one way to guard against or spot red flags in the mortgage origination and/or securitization pipeline that can cause problems down the road is to ensure the loan-input data is correct from the start.

“I think as people shift to try to maintain their volume, it’s going to be important that they document their files well,” he said. “Having well-documented files is going to be key, especially as people look to sell to different entities with different guidelines and different overlays that will require additional scrutiny.”

Another source of data and a good indicator for mortgage fraud are the Suspicious Activity Reports (SARs) that financial institutions must file with federal regulators to comply with the Bank Secrecy Act when they suspect criminal activity might be occurring, such as money laundering or other fraud. The U.S. Treasury Department’s Financial Crimes Enforcement Network, or FinCEN, tracks those filings and publishes the aggregate findings on its website.

A tally of FinCEN’s SARs data collected between 2014 and 2021 shows that total filings have generally trended upward since 2014 across depository institutions (banks); finance companies, which includes nonbank mortgage lenders; and the government-sponsored enterprises (GSEs) Fannie Mae and Freddie Mac

In the specific area of mortgage fraud, however, SARs filings have trended downward at depository institutions, from a high of 35,258 filings in 2014 to 8,805 filings in 2021. The decrease in filings coincides with the rise of nonbanks as a major source of originations in the country.

“The nonbank share for agency [mortgage] originations has been rising steadily since 2013, standing at 75.1 percent in February 2022,” a March report by the Urban Institute’s Housing Finance Policy Center states.

There were 1,150 SARs filings lodged in 2015 related to potential mortgage fraud involving the GSEs, according to the FinCEN data, and last year that number stood at 5,042. For finance companies, mortgage-related SARs filings increased from 963 to 15,805 over that period. (The data for the GSEs and finance companies for 2014 represents only a partial-year reporting, so it was not used for comparison.)

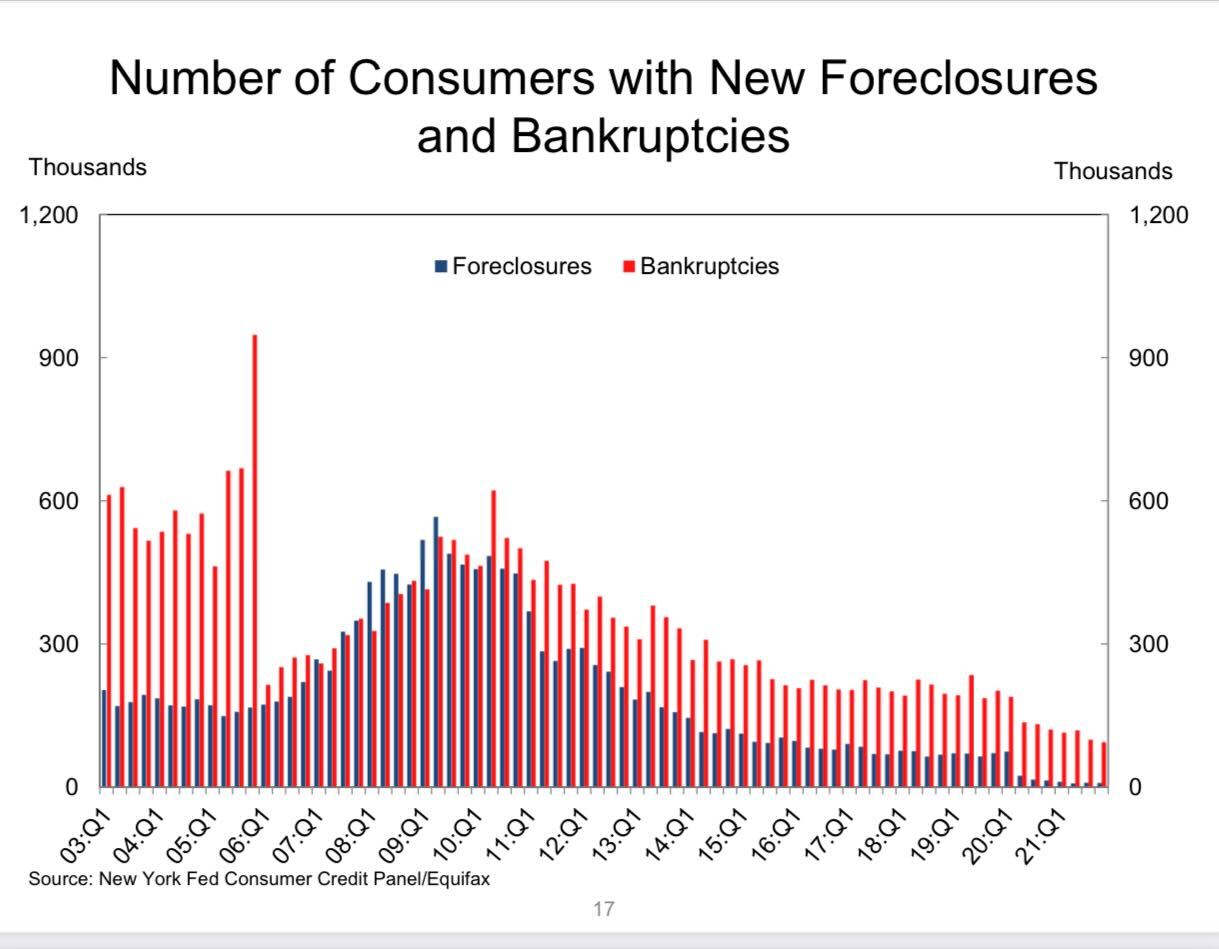
It’s important to note that SARs filings related to mortgage fraud are only indicators of potential criminal activity, not proof positive. In addition, the filing trends are a byproduct of the strengthening, increased awareness and broader enforcement of anti-fraud laws in the years since the 2007-2008 housing market crisis

Following is a breakdown of SARs filings by institutional category for 2021, compared with 2020. Some SAR filings may list multiple suspicious activities.

Depository Institutions – Banks 
SARs Filings Related to Mortgage Fraud
2020: 11,349
2021: 8,805
Down: 22%

GSEs
SARs Filings Related to Mortgage Fraud
2020: 3,343
2021: 5,042
Up 51%

Loan or Finance Cos. – includes nonbanks
SARs Filings Related to Mortgage Fraud
2020: 10,766
2021: 15,805
Up 47%

An FBI backgrounder on mortgage fraud explains that it “is crime characterized by some type of material misstatement, misrepresentation or omission in relation to a mortgage loan, which is then relied upon by a lender.”  

“A lie that influences a bank’s decision — about whether, for example, to approve a loan, accept a reduced payoff amount or agree to certain repayment terms — is mortgage fraud,” the law enforcement agency’s overview states. “The FBI and other entities charged with investigating mortgage fraud, particularly in the wake of the housing-market collapse, have broadened the definition to include frauds targeting distressed homeowners.”

The post Risk of mortgage fraud is on the rise in the current market appeared first on HousingWire.


Source link


Fewer buyers rushed to lock mortgages last month amid a rapid climb in long-term mortgage rates, reflecting home affordability concerns, reports from Mortgage Capital Trading and Black Knight showed. 

Total mortgage rate locks by dollar volume were down 5% in April from the previous month, according to MCT’s monthly Mortgage Lock Volume Indices report. Compared with the same period last year, the number of rate locks by mortgage volume was down 25.4%. 

The average 30-year conforming mortgage rate climbed to 5.27% last week, marking the highest average since 2009, according to Freddie Mac PMMS. Black Knight’s Optimal Blue OBMMI pricing engine, which considers refinancings and additional data from the Mortgage Bankers Association, finished the month of April at 5.42%.

Refinancing has seen the biggest impact of the rising-rate pressure. Rate locks for rate-and-term refinances, which is driven primarily by a drop in interest rates to lower monthly mortgage payments, were down 36.4% in April from the previous month. Compared with April 2021, rate-and-term refinances were down 89.2%. 

Cash-out refinance activity, in contrast, is led by increasing home values by homeowners seeking to tap into their home equity. In April, cash-out refinance rate locks were down 31.1% from March and slumped 51.7% from a year earlier.

Black Knight’s monthly originations market monitor report showed a similar downward trend of mortgage rate locks. Rate lock production volume activity was down 20.3% month over month, driven by a 50% drop in rate-term-refinance lending activity.

Cash-out refi locks dipped 40% in April as homeowners likely sought other products including Home Equity Line of Credits [HELOCs] or second linens, to access tappable equity without sacrificing historically low first-lien mortgage rates, which were secured with real estate as collateral.

In a traditional home equity product, the lender disburses a lump sum of cash upfront to the buyer, who then pays the loan back in fixed-rate payments. A HELOC, by contrast, is a revolving line of credit that allows borrowing as needed, with a variable interest rate. 

April’s decline in rate lock activity is “hardly surprising,” said Scott Happ, president at Optimal Blue, citing half of all mortgage holders holding current first lien rates below 3.5%. The combined decline in refinance locks pushed the refi share of the market down to 20% last month, marking the lowest point on record since at least January 2018, when Optimal Blue began tracking the metric. 

“That being said, while purchase locks were down somewhat from March, they remained flat from last April, reflecting consistent and resilient demand from homebuyers,” Happ said in a statement. 

Purchase rate locks measured by MCT, however, were up 2.2% month over month in April and 7.55% from a year earlier, “a bright spot even as mortgage rates have increased rapidly in 2022.”

MCT, founded in 2001, launched its first monthly mortgage lock volume report on Monday. The indices are based on the actual dollar volume of locked loans, not the numbers of applications. 

“Especially in a tight purchase market. Applications are a less reliable metric for the mortgage industry as there is a higher likelihood of having multiple applications per funded loan,” the MCT report noted. 

Black Knight’s monthly market monitor reports provide origination metrics for the U.S. and the top 20 metropolitan statistical areas by share of total origination volume. The New York-Newark-Jersey City regions had the highest rate lock volume at 4.1% in April. The Los Angeles-Long Beach-Anaheim regions had the second-highest lock volume rate (3.9%) trailed by the Washington-Arlington-Alexandria (3.8%) region. 

The post Mortgage rate locks tumble amid sharp rate rise appeared first on HousingWire.


Source link


Home prices in the U.S. have been skyrocketing since 2020, however, I often like to remind people that no matter how crazy home-price growth is in America, at least we aren’t Canada. When it comes to home prices — and especially home prices compared to income — our neighbors up north are like Godzilla to our gecko.

Over the weekend, I tweeted several charts, showing people the big divergence between home price growth and real disposable income in the two countries. The average home in Canada is now nearly $650,000 in U.S. dollars, which is more than nine times household income.

This divergence isn’t limited to Canada — we aren’t like a lot of other countries around the world either. As you can see below, home prices have deviated from disposable income in a much larger fashion in other parts of the world, making the U.S. look very cheap.

Knowing this reality, my priority before 2020 was trying to convince people that the U.S. wasn’t in a second housing bubble. To persuade people of this, probably one of the most important articles I have ever written in my life was in 2019, titled: Housing Bubble 2019? This was my best attempt to convince the housing bubble boys that what they believed in is more fabrication than reality before the years 2020-2024.

Q2-Global-home-prices

It’s now evident that housing did not collapse and in fact home prices are savagely unhealthy. And it’s not just here in America. As you can see above, other countries have experienced steep home-price growth and Canada is leading the way. Will the U.S. housing market follow Canada?

In short, the answer is no, we won’t have the type of home-price velocity that Canada has experienced because our housing market is more diverse than theirs. What I mean by that is Canada’s home-price growth has been significantly — even overwhelmingly — influenced by its two major cities: Vancouver and Toronto. While the U.S. has its high-priced metro areas, our size and diversity mean that our national home price index won’t ever be driven by just two cities.

In addition, the U.S. housing market is more tied to mortgage buyers. Unlike those two cities in Canada, we aren’t as reliant on foreign buyers to such a great extent. Just last month, Canada’s prime minister proposed a two-year ban on some foreign investors buying Canadian real estate to try to tame price growth. Here in the U.S., foreign buyers have always been less than 300,000 of total home sales for many years. When you think about our total home sales being between 5-6 million, foreign investment isn’t that much.

Size also matters. Canada’s population is near 38 million, whereas the U.S. population is near 332 million. We are a monster compared to them in population and the majority of homebuyers in America use mortgages.

When mortgage rates rise, two things always happen here in America.

1. The days on market grow, which gives people more choices and less forced bidding.
2. The growth rate of home prices slows down.

We saw this in 2013-2014 and 2018-2019. Home prices cooled down, and the days on the market grew. Even though nominal home prices never declined, the growth rate in pricing cooled. This should not change.

I’ve tried to stress that we need to worry about home prices getting overheated in 2020-2024, but not because of some massive credit boom like we saw from 2002 to 2005. As we can see below, our current situation isn’t about mortgage credit getting out of hand. This year purchase application data will have its first real year-over-year decline since 2014.


Because the largest number of homebuyers in America are mortgage buyers, this will keep home prices in check when rates rise. Knowing that demand in the years 2020-2024 has had the potential to break out, I set a firm five-year home-price growth model of 23%. Breaking that threshhold would mean we are in unhealthy home-price growth land. That level lasted only two years, and home-price growth worsened early in 2022.

Luckily, all we needed was the 10-year yield to get above 1.94% to create balance, and since home-price growth has been so hot since 2020, we will see some balance in home-price growth. This will prevent America from experiencing a parabolic growth of home prices breaking above disposable Income, as Canada has experienced.

What I see in the chart below is beautiful; yields are rising and taking some of the excesses out of the economy! The timing of this rise in yields was unique as It was early in February of this year that I went into “team higher rates” mode. On Feb. 20 I pinned a video on my Twitter account as a desperate plea that we needed higher rates to stick. Bond yields and rates took off from that point.


Home-price growth has seen many levels post-1996; the reality is that demand has been stable enough to keep inventory at bay (outside the housing bubble credit boom and bust).

Another factor in our low house prices (compared to other countries) is that other countries never had the excess credit leverage we saw in the U.S. from 2002-to 2005, which led to forced credit selling. This is why I believe Canada and other parts of the world have had continued home-price growth, while the U.S. had to deal with its credit bust.

As we can see below, we needed to deleverage a lot of housing debt as credit in America was getting worse in 2005 through 2008. Then, after all that, the great financial crisis happened. A lot of mortgage debt went away due to foreclosures and short sales, bringing home prices way down.


Currently, the balance sheet of the U.S. homeowner looks great, in fact it’s never been better. The housing crash premise that home prices have to go back to 2012 levels is crazy. Housing debt doesn’t work like margin stock debt. A stock can fall 40% in one day, whereas a home doesn’t have that kind of velocity. One of the reasons homeowners can’t sell their homes at a 50%-80% discount so freely is because the bank won’t allow them to if the home value goes below the house’s debt. The homeowner would have negotiated with the lender on this.

The leverage margin debt trading on stocks, on the other hand, can go up and down much more quickly. This has been a reality with supply for some time now; homeowners would need to have a job loss recession to be forced to sell their homes. With all the nested equity built in, a foreclosure process at scale would have to occur in a deep job loss recession with loans done late in an economic expansion. Those loans with a small downpayment risk foreclosure or short sale if home prices fall quickly during a job loss recession. However, most of the stock of homeowners is doing well, over 40% of homes in America don’t even have mortgages, and the nested equity is massive now.

While the home-price growth in Canada and other countries shows the potential for American home prices to skyrocket, I believe we have limits here in the U.S. Most homebuyers are mortgage buyers, so rates and credit limitations matter. We see a lot of home-price growth in parts of the U.S where more wealthy homeowners are moving, and that is part of the unhealthy home-price growth data we have seen since 2020.

However, even that has limits compared to Canada’s massive home-price growth versus disposable incomes. Our biggest homebuyers are the millennials, so housing demand has limits. Also, mortgage rates have been falling over 2% every new cycle since 1981 to a new low, which would mean if this trend continues, which I doubt, mortgage rates would have to fall to 0.125% – 0.50% in the next recession. This is not likely anytime soon since the low mortgage rates were 2.50% recently and we are over 5% today.

This is why if total home sales in America get to 6.2 million or higher in 2020-2024, consider that a beat and view this period as having a healthy amount of replacement buyers but no credit sales boom. With the massive home-price growth we have seen since 2020, this totally new and existing home sales level that I have been focused on is at risk with higher rates. As you can see below with the homebuyer profile from NAR, most of our buyers are millennials and Gen X. In time, Gen Z will be old enough to buy more, but we’re not there just yet.

From NAR:

Home prices have accelerated too much, in my view, but with rates now rising, we should see a cooldown in demand. What happens with higher rates is that we see more days on the market, and the growth rate in pricing cools down. I know it’s fun on social media to compare the home price growth in Canada versus the United States, but in reality, I don’t see us having similar dynamics so that the U.S. would boom in prices so much that we would catch up to Canada’s home-price growth levels versus disposable incomes. 

So, yes, it’s a good thing we aren’t Canada because we would be having a much harder housing affordability crisis if we did!

The post Think US home prices are high? At least we aren’t Canada appeared first on HousingWire.


Source link


This week’s question comes from Rodney through Tony’s Instagram direct messages. Rodney, like many investors, has been told that you need twenty percent down to buy a rental property. Rodney wants to know the best way to fund a property without breaking the bank. He’s asking: Should I save for a down payment or is there a way to get a rental without the twenty percent down?

It’s not uncommon for real estate investors to get into deals with far less than 20% down. But, for a beginner, this type of task can seem a bit intimidating, especially if you’re looking at your first investment property. Thankfully, the world of real estate presents investors like us with many ways to creatively fund deals!

If you want Ashley and Tony to answer a real estate question, you can post in the Real Estate Rookie Facebook Group! Or, call us at the Rookie Request Line (1-888-5-ROOKIE).

Ashley Kehr:
This is Real Estate Rookie, episode 180. My name is Ashley Kehr, and I am here with my co-host Tony Robinson.

Tony Robinson:
And welcome to the Real Estate Rookie podcast, where we focus on those investors at the beginning of their journey. Maybe you haven’t done a deal. Maybe you’ve done a deal or two, and you’re looking to scale. Either way, this is the podcast for you. Ashley Kehr, my co-host, what’s going on?

Ashley Kehr:
Not much. I have my little assistant, Remington James, here next to me. If you’re watching on YouTube, you can see a little bit of his cute little face, but he’s patiently waiting until it’s time to go to the movies tonight to see Sonic 2.

Tony Robinson:
Oh, okay. I love that. Sonic 2, I haven’t seen that. No. Is that with Jim Carrey is it? Isn’t he in Sonic?

Ashley Kehr:
He’s in it. Yeah, he’s in the first one so he’s probably in the second one. Yeah.

Tony Robinson:
Oh, okay. All right. Cool. Cool. I love that. Well, yeah. What else is going on, Ash? What you got? What’s going on in the business? What’s new?

Ashley Kehr:
Yeah, I don’t know.

Tony Robinson:
How’s the MCL? How’s the ACL?

Ashley Kehr:
It’s doing good. I got it straightened out right now. Trying to get it straighter over time. Been going to physical therapy a lot. My physical therapist has become my best friend, is the only person I see every day. But yeah, it’s going slow, but going good. I have one more week left on crutches and then I can at least ditch the crutches and go on, just have my brace on. And I’ll have that on for about another four weeks.

Tony Robinson:
All right. Well, there you go. Progress.

Ashley Kehr:
Yeah. Yeah, yeah. And what about you? Are you doing well after getting over your competition? Are you splurging?

Tony Robinson:
I am. I’ve been-

Ashley Kehr:
What’s your diet look like these days?

Tony Robinson:
My diet has literally been everything though, actually. I’m eating pizza, cereal. I’m rebounding real hard and heavy, but we got another show planned for August. I got a couple weeks off and I’ll start ramping up for that next show. If you guys want to follow along on that journey, be sure to follow me on Instagram, @tonyjrobinson. And if you want to follow Ashley along on her recovery, she’s @wealthfromrentals on Instagram as well.
But speaking of Instagram, today’s question actually comes from our DMs. If you guys want to get your question featured on the show, you can get active in the Real Estate Rookie Facebook group, get active in the BiggerPockets forums, or you can slide into the DMs. Maybe Ash and I will pick your question.
Today’s question comes from Rodney Hill. And Rodney’s question is, “There is one question that stumps me. People say you can do your first deal with no money down. Yet others say you need 20% down payment. I live in Tampa and a 20% down payment is between 30 to $60,000. But an investor gave me advice. Said just get $25,000 saved up and then I should be able to do my first deal. I don’t know if that makes sense or if it’s gibberish, but my question is, should I save 25 to 60K for a down payment on my first rental? Or is there a way I can get into a rental with less than 25% down?” What are your thoughts, Ash?

Ashley Kehr:
Well, I think this is a great question for you just talking about the vacation loan. If he wants to do long distance investing. Or what is the rule on that, 10? Or not 10, two hours away from your primary?

Tony Robinson:
Yeah, typically-

Ashley Kehr:
I think go into that first, because I think that’s the first thing that pops into my head is that vacation loan mortgage and you know that better than I do.

Tony Robinson:
Yeah, totally. It’s yeah, the second home or vacation home mortgage, it’s a 10% down payment. There are some restrictions. You have to be, or the property that you’re buying, the second home has to be, I think typically 60 ish miles at least away from your primary residence. You cannot have more than one in the same geographic area. If you buy one in Tampa, you can’t buy your second one in Tampa.
And then you have to use the property for personal use typically for at least 14 days out of the year. As long as you’re able to check those boxes, you’re able to then rent that property out on sites like Airbnb and Vrbo when you’re not using it.
Now, interest rates on those loans used to be almost in lockstep with primary residences. Now, we’re seeing them to be about a point higher. There’s been some changes in how the government is regulating those. But we’ve scaled a lot of our portfolio using the 10% down second home loans in different markets.

Ashley Kehr:
Yeah. The second thing that would come to mind for this is seller financing. Talking with a seller where you don’t have to put down a huge down payment and you can put down a smaller down payment. And it’s not like they need to keep that mortgage for you or hold that mortgage for you for 30 years. You can make a balloon payment or make it callable in a year, a couple years. Enough time that you can add some value to the property and then go to a bank and refinance all of your money out, just doing the BRRRR strategy. But instead of bringing your own cash or money from a personal line of credit, you’re having the seller hold the mortgage for you.
A couple ways to actually approach that with a seller is to say to them, “I know, have you talked to your CPA or accountant at all about seller financing and often they will say, “No, I haven’t.” And you can say, “Oh, okay. I just didn’t know because of all the tax advantages. If you wanted to maybe talk to them, I’d be interested in doing that too.”
And that usually at least gets the wheels turning on the seller to have that conversation with their CPA because their CPA is going to be your best friend, because they are going to say, “Yes, it is an advantage. Because instead of taking this lump sum of $200,000 in one tax year, the amount of money you’re taxed on is going to be spread out over those payments that you’re getting over three years or however long they’re going to hold the seller financing.”
If you look at the income tax brackets, as you increase your income each year, you’re taxed at a higher rate. If you’re taxed, if they’re only getting 50,000 of that in the first year, they may only be taxed 15%. If they get that whole 200,000, then maybe they’re going to be taxed, I don’t know. I don’t even know what the tax brackets are right now. 35% or whatever.
I’m winging it. I actually was on a call the other day. I had someone look it up while I was talking about the same thing, but so you have their account or CPA sit down with them and talk to them about the tax advantages of doing seller financing. I think that’s a second great option too.

Tony Robinson:
Yeah. I think a third option, I mean, there’s so many options. And I think that’s the beauty of real estate, but a third option is find a partner that does have the capital. And I know the initial rebuttal to find a partner is, “Well, I don’t know anybody.”
And luckily for you, it costs nothing to go out and meet people. Rodney, if you go to your local real estate meetup, if you get active on the BiggerPockets forums, if you get active in the BiggerPockets Real Estate Rookie Facebook group, and you start networking with people and saying, “Hey, here are the kind of deals that I’m looking for.” And you start finding out if there is anyone that would be interested in those deals, but they don’t have the time, desire and ability to manage that property. Or maybe if it’s a rehab, to manage the rehab. Identify what value you can bring to that person and then maybe there’s a way that you guys can work together.
We have interviewed guest after guest, after guest that has done something similar where there’s someone that has the capital, but they don’t have the time, desire and ability to find the deal, manage the rehab, manage the tenants, do all the things that come along with actually turning that property into a solid investment. Build your network, find good deals and see if you can provide value in that way.

Ashley Kehr:
I think that’s how you’ve built a lot of your business is taking advantage of that, where you are the experience. You can manage the properties, you can get the properties, you know everything. And then your partners are the ones that are coming with the money and leaning on you for all of those qualities, all those traits, all that whole skillset.
And for my first property, and even for the first several properties, I took on a money partner. And that was how I got started was just partnering with someone. And we actually did an LLC together where we were partners. And I think that scares a lot of people, is like, “Oh, I don’t want to be tied into a business with someone.”
But Tony, you structure your partnerships with a joint venture agreement where there’s a lot less liability. I think that’s another option too, to look at is you’re not having to open a bank account with this person. And you’re not having to file a tax return together, all these different things. You can do the joint venture agreement, which keeps you a lot more separate. And you don’t have that, you’re not tied together so much, especially when it’s your first deal you’re doing together.

Tony Robinson:
Yeah. Rodney, there are so many ways that you can go about getting that first investment without having to come up with the capital yourself. Hopefully, some of the things that Ash and I pointed out today is some actionable advice for you and for all the other rookies that are listening. But start taking action, man. Build that network, start networking and seeing who you can find that might be able to help you and you be able to help them.

Ashley Kehr:
Well, thank you guys so much for listening. Don’t forget to leave us a review on your favorite podcast platform. I’m Ashley @wealthfromrentals, and he is Tony, @tonyjrobinson. And we’ll see you guys next time.


Source link


California-based nonbank mortgage lender Pennymac Financial Services’ net income dropped more than 50% in the first quarter from the same period in 2021, driven by lower profits from its production segment due to surging mortgage rates and a shrinking origination market. However, the company still reported a pretax net income of $234.5 million in the first quarter, essentially unchanged from the prior quarter.

The firm’s earnings were driven by its servicing portfolio and about $520 billion in unpaid principal balance, said David Spector, chairman and chief executive officer of PennyMac in an earnings call. 

Pennymac’s servicing portfolio grew to $518 billion in unpaid balance, up 2% from Dec. 31, 2021, and 16% from March 31, 2021, led by production volumes which more than offset prepayment activity, according to Spector.

“The unprecedented increase in mortgage rates resulted in lower overall industry origination volumes and left originators and aggregators who still hold excess operational capacity competing for a much smaller population of loans,” Spector said.

The production segment pretax income was $9.3 million, down from $106.5 million in the last quarter of 2021 and $362.9 million in the first quarter that year. 

The consumer direct interest rate lock commitments (IRLCs) were $9.1 billion in unpaid principal balance, down 36% from the previous quarter and 32% from the first quarter of 2021. Broker direct IRLCs declined (38%) at a steeper rate than government sponsored IRLCs (27%) from the same period last year. 

Total loan acquisitions and originations were $33.3 billion in unpaid balance, down 29% from the previous quarter and 50% from the first quarter of 2021. 

Among its multi-channel production business, Pennymac’s consumer direct market rose from 1.6% of total originations in 2021 to 1.7% this year, according to Spector. He expects the company to grow market share in that channel as it leverages “servicing portfolio, new technology and advanced data analytics capabilities,” without mentioning further details. 

The correspondent channel had the largest market share across Pennymac’s business at 15.8% in the first quarter. Loan servicing followed at 4.1% and broker direct channel trailed at 2.2%. 

Pennymac’s servicing segment pretax income was $225.2 million in the first quarter, up from $126.1 million in the previous quarter and $141.7 million in the same period in 2021. 

The firm’s servicing and subservicing fees rake in more than $1 billion in revenue annually, according to Doug Jones, the firm’s president and chief mortgage banking officer. Jones added Pennymac began to work with home protection insurance firm Hippo Holdings to offer homeowners insurance and the firm is evaluating other potential partnerships to offer additional products without mentioning details. 

In January 2021, the firm launched a new technology platform in its wholesale channel and rebranded its broker division from PennyMac Broker Direct to Pennymac TPO. 

While Spector said the company’s first-quarter earnings was “solid,” he noted mortgage rates rose faster than predicted and Pennymac has taken steps to better align its expenses. 

Pennymac announced layoffs of 236 employees in six different California offices in March. Most of the positions that were affected by the announcement were home loan specialists, including those with expertise in refinancing. 

The firm’s return on equity was 20% in the first quarter of this year and is projected to trend lower before returning to its pre-pandemic range, according to Spector. Pennymac’s ROE was 61% in 2020 and 29% in 2021. 

The company continued to buy back shares of its stock. It repurchased about $141 million dollars worth of stock in the first quarter, down from $257.3 million in stock buybacks from the previous quarter. 

“The pace of share repurchases was down from last quarter as we believe it is prudent to retain capital during periods of greater volatility,” Spector said. 

PFSI’s stock closed Thursday at $48.38 following the earnings publication, down 4.6% from market opening. The stocks fell 1.1% on Friday to $47.84 at around 2:40 pm. 

The post Pennymac notches a profitable Q1 due to servicing segment appeared first on HousingWire.


Source link


Two significant things happened on Friday: the Bureau of Labor Statistics reported that the U.S. created 428,000 jobs in April, and I had to raise another recession red flag. First, let’s look at the jobs picture.

string of positive job revisions we’ve seen this year ended with a negative 39,000 print; however, the job report was solid and continued the trend of good reports in 2022. The unemployment rate is at 3.6%, and we are getting closer and closer to my forecast of getting all the jobs lost to COVID-19 by September of 2022.

From BLS:  Total nonfarm payroll employment increased by 428,000 in April, and the unemployment rate was unchanged at 3.6 percent, the U.S. Bureau of Labor Statistics reported today. Job growth was widespread, led by gains in leisure and hospitality, in manufacturing, and in transportation and warehousing.

The internals of the labor market are very healthy; job openings are over 11.5 million. A year ago I wrote and tweeted that we should get job openings over 10 million in this recovery, so this isn’t surprising, but it’s still shocking to see such high job openings on this report. Remember, the trend has been your friend since 2009: the Baby Boomers can’t work forever, and no country has a Dorian Gray labor market. In time, older workers need to be replaced.

I never talk about labor force participation rates because it is the most useless labor data we have. Everyone had forecasted this data line to fall in the 21st century, and it has; nothing is wrong with this. People generally make too much of this data because it makes a sexy headline. So the fact that this fell means nothing to me, nor will it ever in my life. It won’t mean anything to me in the afterlife, either.

The data line that I track that matters most will always be prime-age employment to the population data because that is the proper working-age workforce, not people 16-24 or 55 and over. The employment-to-population percentage for the prime-age labor force fell in this report, but is 0.6% away from being back to February 2020 levels. The jobs recovery in this new expansion has been much better than we saw during the recovery phase after the great financial crisis.

The current jobless claims data is very low historically, as the hunt for labor and making sure to retain workers is a real issue for companies. This is a weekly data line that has been in a downtrend for some time.

Even though I retired my America Is Back Recovery model on Dec. 9, 2020, I knew getting all the jobs back lost to COVID-19 would take some time. So, September of 2022 was the target date that I believe we will achieve those pre-COVID-19 levels. Of course, we had to deal with Delta and Omicron variants, but still, we are on pace to get all the jobs back by September of this year.  

—Feb 2020: 152,553,000 jobs
—May 6, 2022: 151,314,000 jobs

That leaves us with 1,239,000  jobs left to make up over the next six months, which means we need to average adding 247,800 jobs per month. The unemployment rate currently stands at 3.6%.

Look at the jobs data and which sector added jobs in March: Construction jobs came in positively, but the real winner was manufacturing jobs.

Job openings in construction and manufacturing are big in America today. The notion that robots and immigrants took all the jobs was simply a joke.

As we can see, the labor market is solid and has some legs. When the economy is back to normal, I expect to see much smaller job gains as our country lacks the population growth to have big job numbers unless it’s coming off a recession.

Now to the second big news: the recession red flags.

Recession red flag model: 4th flag raised today

For every recovery model, you need to have a recessionary model. Traditional cycles can be forecasted correctly; it makes things interesting when you get a shock like COVID-19. The United States of America was still in an expansionary mode in 2019 and 2020 before COVID-19 hit us. For a more traditional economic expansion and recession, here is the model backtested with the housing bubble years, in which the red flags were all up in 2006.

The fourth recession red flag looks for over-investment in the economic cycle. What sector was so hot that the demand for that sector couldn’t be sustained? Retail sales, durable goods spending, and the e-commerce side of this expansion saw an epic boom due to COVID-19. Now those stocks are getting deflated and the demand for durable goods can’t be sustained.

I use the company Peloton and their boom-and-bust cycle as an example of what a job-loss recession looks like. This company had booming demand, and then that demand collapsed, leaving them with too many workers that they had to fire. It also derailed their plans for a manufacturing plant to build more bikes.

Amazon recently spoke about being too big and having too much capacity after the massive surge in consumer demand. As demand normalizes, the need for this much labor and capacity doesn’t seem apparent anymore. This is very common in boom-and-bust cycles where for some time you need more people and capacity to fill in demand, but if that demand doesn’t sustain itself, you will have spare capacity. If you want to hear some encouraging news about the growth rate of inflation peaking out, this news from Amazon is it.

There are two final recession flags, which are always the most important.

— The Leading Economic Index falls four to six months before every recession. Of course, this hasn’t happened, but this data line had an epic recovery from April 2020, the same month I wrote the America is Back Recovery model.

— New home sales and housing starts traditionally fall into a recession. This is where the 5% plus mortgage rate world can facilitate this red flag going up. So far, this hasn’t been the case, but this is 100% something we need to focus on.

As an economic expansion matures, we always look at different variables. Housing holds a key right now as the last two recession red flags would need real estate to get weaker for us to discuss a recession. Of course, the Russian invasion of Ukraine and the China lockdowns are out of our control, but we can still create models that factor them in our expansion and recession. Ultimately, it will be all about the U.S. consumer, who has always been our engine of economic growth, and we will see if they can keep the last two flags from being raised.

The post Amazon news raises new recession red flag appeared first on HousingWire.


Source link


A ruling late last year by a U.S. District Court judge in Wilmington, Delaware, put the structured-finance industry on high alert because of the serious legal and financial implications it poses for the private-label securities (PLS) market.

The fate of the litigation is now in the hands of the U.S. Court of Appeals for the Third District, however. The federal appeals court, based in Philadelphia, this week decided to weigh in on the major arguments in the case by agreeing to hear a rare interlocutory appeal filed by the defendants — a group of student-loan securitization trusts.

Normally, parties to a case cannot appeal until the lower court enters a final judgement. If a case raises important legal questions, however, they can seek permission to appeal early, while the case is still pending, via an interlocutory appeal.

In the litigation, “Consumer Financial Protection Bureau v. National Collegiate Master Student Loan Trust et al.,” a group of 15 student loan trusts stand accused by the CFPB of being liable for the deeds of loan servicers that were acting on behalf of the securitization trusts. Those services filed multiple allegedly flawed lawsuits in state courts to pursue loan defaults against borrowers.  

The servicers allegedly “executed and notarized deceptive affidavits” and “filed … collections lawsuits lacking” important evidence, according to pleadings in the federal case — pending since 2017 in U.S. District Court for the District of Delaware.

“The Third Circuit Court’s decision to hear the appeal allows the trusts’ appeal to be docketed and the issues will now be fully briefed over the coming months, effectively pausing the [lower-court] legal proceedings against the trusts, pending the Third Circuit’s review,” the Structured Finance Association (SFA) stated in an email alert sent to its members. “SFA will continue its advocacy on the matter and closely monitor any developments in the case. 

“Additionally, SFA will seek to submit an amicus [friend of the court] brief to inform the court on the negative impact that a finding of trusts as ‘covered persons’ would undoubtedly have on the securitization market.” 

The 15 trusts being sued by the CFPB were set up to securitize a total of 800,000 student loans, according to the original complaint filed by the federal watchdog agency. The trusts are administrative entities sans employees, so they collect and service the debt in the securitized loan pools through third-party servicers. Mortgage securitizations in the PLS market have a similar structure.

The trusts say the CFPB lacks authority to sue them because they are not ‘covered persons’ under the Consumer Financial Protection Act,” U.S. District Court Judge Stephanos Bibas wrote in his precedent-setting ruling issued in December 2021. “But they ‘engaged in’ servicing loans and collecting debt through their contractors [the loan servicers], so they fall within the statute. I must thus let the CFPB’s case proceed.”

The questions that are now being considered in the recently accepted interlocutory appeal of Bibas’ ruling, according to the court pleadings, are whether the student loan securitization trusts — and by extension PLS trusts — can be considered “covered persons,” subject to the authority of the CFPB. 

The other question on appeal is whether the statute of limitations has run out on the CFPB’s lawsuit because it was initially filed “while the [CFPB’s] director was improperly insulated from presidential removal.” 

That second question stems from a constitutional controversy settled by the U.S. Supreme Court during the waning months of the Trump administration that reversed a congressional restriction on the president’s power to remove the CFPB director. The CFPB’s lawsuit against the trusts was approved by CFPB leadership and filed in federal court prior to the U.S. Supreme Court’s ruling in 2020. A new CFPB director, removable by the president, later ratified the lawsuit to cure any potential statute-of-limitations defect — a move now being challenged on appeal. 

Michael Bright CEO of the Structured Finance Association, added that if the lower-court judge’s ruling is allowed to stand, the PLS market would have to “adapt pretty substantially.”

“Investors will need to quantify and charge for the risk that they will be held accountable for [with respect to] the acts of third-party servicers…,” Bright said. “It completely upends the construct of securitization.”

How long the Third Circuit Court of Appeals will take to issue its final opinion on whether or how the case should proceed is not clear. It’s ruling for now is simple, according to the pleadings: “The Court of Appeals has granted a petition for leave to appeal in this matter.”

The post Lawsuit pits PLS industry against CFPB appeared first on HousingWire.


Source link


Add Guild Mortgage to the list of lenders with profitability propelled by the servicing portfolio in the first quarter — a trend that will continue in the coming months, as pressure on origination margins will remain, executives believe.  

The California-based nonbank mortgage lender reported a $208 million net income from January to March, an increase of 393% quarter over quarter and 29% year over year.  

“Origination volumes and gain on sale margins were compressed compared to prior quarters, consistent with broader industry trends,” Mary Ann McGarry, Guild’s CEO, said during a call with analysts on Friday morning. “Our servicing platform acted as a hedge, with strong growth in servicing fees, as well as sizable gains in the underlying value of the MSRs.”

The main contribution for the quarterly earnings came from adjustments in the fair value of the mortgage servicing rights (MSR), which brought in $184.6 million in net revenues in the period, compared to a negative $17 million in Q4 2021 and $35.7 million in Q1 2021. 

MSR values tend to initially increase as mortgage rates rise and borrowers are less likely to refinance. “Going forward, assuming interest rates continue to trend higher, slower prepayment speeds will likely persist, thereby driving further measured markups in the underlying value of our MSR assets on our balance sheet,” Terry Schmidt, Guild’s president, said to analysts.  

In total, Guild ended the first quarter with $73.2 billion in unpaid principal balance, up 3% quarter over quarter and 16% year over year. The net income attributed to the servicing segment was $226.8 million, compared to $27.3 million in the previous quarter and $67.1 million in the same quarter of 2021. 

Guild, a purchase-focused lender with a distributed retail model, registered a deterioration in the origination business. The company reported $6 billion in origination volume, down 31% from the previous quarter and 38% from the same period of 2021, with purchases representing 66% of the total. 

The gain-on-sale margin on pull-through adjusted locked volume declined from 4.80% in the first quarter of 2021 to 3.94% in the fourth quarter of 2021 and 3.34% in the first quarter of 2022.

Executives believe margin compression will remain for the second quarter. “The margin on unadjusted locked volume in the first quarter is more indicative of the trajectory in the short term,” Amber Kramer, Guild’s CFO, said during the conference call. “We’re just not seeing from a competitive pricing standpoint that we’re necessarily near the bottom.” 

The origination segment’s net income was $63.4 million in Q1 2022, compared to $53.4 million in the previous quarter, a 19% increase due to adjustments made to reflect changes in the fair value of contingent liabilities related to acquisitions. Compared to the first quarter of 2021, the origination segment profit declined 60%.  

Guild had $243 million in cash and $1.9 billion of unutilized loan funding capacity as of March 31, 2022. The liquidity, according to executives, may support mergers and acquisitions and a $20 million share repurchase program approved by the board on Thursday.

Guild’s share were trading on Friday afternoon at $9.10, up 5.81% from the previous day.

The post Guild Mortgage reports a $208M profit in Q1 appeared first on HousingWire.


Source link


HW-Logan-Q-and-A

In this HW+ Slack Q&A, HousingWire Lead Analyst Logan Mohtashami gives a small preview of the upcoming Housing Update webinar and what he will be focusing on during the discussion. If you have not registered for the Housing Update webinar that’s set for May 10th, please go here

As a member of HW+, you get access to 30-minute Slack Q&As, where we invite the HW Media newsroom to break down the hottest topics in the industry. This Q&A was hosted in the HW+ Slack channel, which is exclusively available to members. To get access to the next Q&A on May 20th, you can join HW+ here.

The following Q&A has been lightly edited for length and clarity. This Q&A was originally hosted on May 4.

HousingWire: We started our last session talking about purchase data and its moving parts, so Logan, how is demand holding up?

Logan Mohtashami: One thing that has surprised me so far in 2022 is that demand is holding up better than I thought. I am a big believer in purchasing application data on a year-over-year basis. Typically I put the most weight on this index from the 2nd week of January to the first week of May. After May, total volumes fall. So far this year, with the rise in mortgage rates, it is still trending better than I thought it would have with rates over 5%.

So, let’s take a look at where we are at, and remember; this data line looks out 30-90 days, so it’s a great forward-looking inductor Purchase application data:
+ 4 % week to week
– 11% year over year
– 12% on 4-week moving average year over year

This data line has been negative year over year since June 2021. However, that was due to Covid-19 high comps that ended in February of this year.

MMBA-may-4th-INK-

Some historical references:

The last two times rates rose, this is what we saw — 2013/2014 negative — 20% year over year trend 2018 purchase application data was flat to slightly positive all year long; we only had three mild negative years over year prints when rates headed to 5%.

MMBA-may-4th-2018-2014-INK-1-1

Sales trends always fall when rates rise, as we can see below. The sales data we have had already this year is backward-looking. So, expect the sales trend to drop some more. However, purchase application data is doing better than I thought by 6%-10% YoY.

4-Existing-home-sales-NAR-Ink-1

A good rule of thumb is that when this data line shows weakness or strength more prominently, it’s up 20%-30% or down 20%-30% on-trend. We haven’t seen that yet; the -12% YoY decline is a noticeable weakness, but nothing too dramatic yet like what we saw from 2005-to 2008.

During the Covid-19 weakness and recovery phase, we saw negative 25%-33% year-over-year prints, and the recovery saw some positive 25%-33% prints. This data line is trend survey data. 2022 will be the first actual negative purchase application data year since 2014.

HousingWire: Will inventory finally break the streak and be positive year over year?

Logan Mohtashami: The year-over-year inventory trends will finally show some positive prints in the upcoming weeks. Higher rates are doing what they usually do, they create more days on the market, which allows inventory to grow.

The big difference now compared to the last time rates rose and created more inventory is that inventory levels were a lot higher back in 2014 than where we are today in 2022.

Existing-home-total-inventory-950K

However, we will take what we can get because home prices were running way too hot in 2022.

5-Case-Shiller-5-Real-You-Price-YOY

While we are still far away from 2018/2019 levels of total inventory, anything, and I mean anything, we get is a plus now.

April-Active-Listings-2

HousingWire: What is the biggest risk to your balance housing market take?

Logan Mohtashami: The most significant risk to my balance housing market take is that the economy starts to show some real weakness, and the inflationary data rate of growth begins to fall. Then the bond market will sniff this out and send bond yields lower, which means mortgage rates will fall.

This has always been the case in the past. Europe’s economy is slowing down. China’s economy is in a mess with its lockdowns, Russia is in a recession, and Japan’s economy still lacks the Tourism it needs. So, the U.S. once again is holding the world up. However, we see some cracks, and 3 out of 6 recession red flags are up, with the 4th one identified.

The last two big ones for my recession flags:

  1. Leading economic index falls 4-6 months before a recession; so far, it’s just pausing here, No noticeable declines.
4-LEI

For all the nerds out there, here are the components of the leading economic index.

2022-LEI-Comp-1
  1. New home sales fall, which will create a slowdown in housing construction. So far, this hasn’t happened yet, but this is something to keep an eye out for for the rest of the year.
4-New-home-sales-

HousingWire: What are some of the key points that you think will be the hot topic for the housing update event happening on May 10th?

Logan Mohtashami: For the May economic forecast event, I will be focusing more on forward-looking indicators and how they should work with the inventory channels. Once mortgage rates rose after the price gains we had in 2020-2021 and 2022, we should have a shift in the housing market, and I believe we have to look at the forward-looking indicators.

Have more questions for Logan? Share them in the comment section below. We will work to address them here or in the next Slack Q&A session.

The post How is housing demand holding up? Logan Mohtashami answers appeared first on HousingWire.


Source link


Banks could receive many more failing grades from their regulators under a recently proposed overhaul of the Community Reinvestment Act (CRA).

That’s partly because, according to a joint notice of proposed rulemaking from bank regulators on Thursday, banks’ performance would be judged by where they lend, not just where they have branches. Doing so would result in 32% of examined lenders receiving a “Needs to Improve” score, compared to the 16% earning that mark for their retail performance from 2017 to 2019, bank regulators estimated.

Don’t expect the regulators to start denying bank mergers yet, however. The Office of the Comptroller of the Currency, the Federal Deposit Insurance Corporation and the Federal Reserve, which together proposed the changes to the CRA, so far have not suggested that any changes be made to how the law is applied to merger and other applications related to acquisitions and expansions.

Still, the proposed rule could set the stage going forward for expanding the CRA’s reach and the increased consideration of community performance during merger reviews — as banking agencies weigh future changes to regulations governing those transactions.

“Honestly we don’t know if that is coming or not,” said Ricard Pochkanawala, senior policy council at the Center for Responsible Lending. “But what we hope to see is that this leads to more transparency of financial institutions serving minority and low- and moderate-income communities, and that it is used and applied in actually, stringently, scrutinizing bank mergers.”

The CRA mandates that bank regulators take CRA performance into account when reviewing bank mergers, but the agencies have not denied a merger on those grounds in more than a decade.

While the proposed rule’s impact on bank mergers is unclear, it does call for big changes to how CRA examiners evaluate banks and the impact their activities have on communities. It also would increase data disclosures on banks’ minority lending practices.

The agencies proposed expanding the granularity of grades assigned to all banks, distinguishing between “low satisfactory” and “high satisfactory,” something that the National Community Reinvestment Coalition has encouraged.

The proposal also would rejigger the asset categories, adding a new category of “intermediate” banks — defined as $600 to $2 billion in assets — and increasing the asset threshold for small banks to $600 million, up from $346 million. Large banks would be defined as having more than $2 billion in assets, up from the current $1.384 billion cap.

One big change under the proposed rule is that large banks would be assessed based on where they actually make loans, instead of only on the basis of where they have established branches, “a relic of the era before interstate banking,” Buzz Roberts, CEO of the National Association of Affordable Housing Lenders, said. Banks also would be able to get credit for community development activities, even if that work occurs outside of their branch footprint.

“That’s a great simplifier, and it’s also great for communities,” Roberts said. “It’s very strange that banks couldn’t get credit for activities beyond their branch footprint.”

Regulators also would scrutinize the services large banks offer, including their digital and remote offerings. In addition, if the proposed rule is adopted, examiners would specifically look at how responsive banks’ products are to low- and moderate-income communities. Examiners would also further analyze that performance, to detect whether banks are offering different levels of services to low- and moderate-income neighborhoods, compared with more upscale areas.

New assessment categories for CRA exams also would be put in place for large banks. Currently, examiners look at lending, investment and service. The new categories would include two for retail, one focused on lending, and the other on services and products; and two categories focused on community development — one pertaining to financing and the other to services.

The retail services and products test would evaluate the responsiveness of large banks’ products and programs to the needs of low- and moderate-income people, small businesses and small farms.

Small-dollar mortgages, for example, could be viewed as a responsive home-mortgage product, the proposed rule states. The bank regulators also are considering whether special-purpose credit programs should be viewed as another example of a responsive product or program. In February, the agencies issued a joint statement in support of the targeted lending programs.

The regulators’ proposed rule also would establish specific standards for banks to get credit for activities that respond to community needs. That’s in sharp contrast to the current evaluation process, which has “no clear standards,” and thus relies heavily on examiner judgment, the bank regulators wrote in their joint proposal. The move would create a list of activities that can receive CRA credit, which would be updated periodically as other activities are approved.

Robert Nichols, CEO of the American Bankers Association, said in a statement that he appreciated that banking regulators are trying to provide “greater clarity, consistency and transparency to banks seeking to meet the needs of their customers and communities.”

The proposed rule also would mandate the disclosure of data on the distribution of minority groups and ethnicities across loan applications and originations.

That might eliminate the back-and-forth that sometimes occurs between community groups and banks. Community groups, during merger reviews, point out deficiencies in banks’ minority lending by analyzing Home Mortgage Disclosure Act (HMDA) data. The banks then counter those arguments with their own analysis of HMDA data, which often differs from the community groups’ assessment of the data.

The joint notice of proposed rulemaking is the culmination of a years-long effort to overhaul the CRA, which was enacted in 1977 to combat redlining. The Office of the Comptroller of the Currency, or OCC, which supervises the largest banks, issued its own proposed update to the CRA in June 2020, but rescinded that rule in December 2021.

Although the anti-redlining law never included race-specific language, the advanced notice of proposed rulemaking for the CRA, which was proposed in October 2020, did offer a pointed question on race. It asks how the regulation could better address ”ongoing systemic inequity in credit access for minority individuals and communities.”

The agencies launched the notice of proposed rulemaking jointly with an acknowledgement that, “even with the implementation of the CRA and the other complementary laws, the wealth gap and disparities in other financial outcomes remain persistent.”

Even though there is a growing consensus in the housing industry and in the affordable-housing advocacy community that the CRA should address race, the bank regulators were careful to stay within the bounds of the statute.

“The agencies were concerned about doing something that the Supreme Court would reverse, which would erase the value of improving clarity and consistency,” said David Dworkin, CEO of the National Housing Conference. “On the other hand, everyone, including banks and regulators, wanted to do something that was a tangible improvement about how we treat race in the CRA. Doing those two things is difficult.”

The agencies will receive public comments on the proposed rule until August 5.

The post Ready or not, CRA modernization is at the door appeared first on HousingWire.


Source link