Today new home sales beat estimates, and new home median sales prices hit an all-time high. What is going on here? My job is always to be the detective, not the troll so let’s take a look at today’s data, as there is a constant theme here that I have talked about for some time. Hopefully, I can make sense of this report, which showed the home sales beat estimates with prices still at all-time highs.
From Census: New Home Sales Sales of new single-family houses in October 2022 were at a seasonally adjusted annual rate of 632,000, according to estimates released jointly today by the U.S. Census Bureau and the Department of Housing and Urban Development. This is 7.5 percent (±20.8 percent)* above the revised September rate of 588,000, but is 5.8 percent (±19.6 percent)* below the October 2021 estimate of 671,000
New home sales haven’t gone anywhere for a few months now, and this report also had negative revisions to the prior reports. The cancellation rates are rising, this is true, but the Census reports don’t properly account for those sales being lost. In theory, the sales levels are lower than the data will show.
Also, these reports are very wild month to month, so we can get a swing back lower in next month’s report. However, with all that said, new home sales are historically low today and have been for some time. We are well below the 2000 recession level and back to 1996 levels.
When you account for a population of over 330 million people, that sales number looks a lot lower than in 2000 and 1996 so be mindful that we are trending at low levels today.
While the actual sales trends can be more downward than the report shows, it’s not off by a significant amount. We are, for now, bouncing off the bottom that we had back in 2018, which was historically low as well.
In 2005, when the housing bubble peaked in sales at around 1.4 million, we had a clear, aggressive downtrend in sales with cancellation rates rising aggressively. Today we are finding a low base for now, because new home sales are historically low.
I would be careful reading too much into this report or even the current trend. The housing market has been in a recession since June of this year, and we have other data lines that can be more useful in gauging the new home sales sector.
From Census: For Sale Inventory and Months’ Supply The seasonally adjusted estimate of new houses for sale at the end of October was 470,000. This represents a supply of 8.9 months at the current sales rate.
My rule of thumb for anticipating builder behavior is based on the three-month supply average. This also has nothing to do with the existing home sales market; this monthly supply data is only for the new home sales market.
When supply is 4.3 months, and below, this is an excellent market for builders.
When supply is 4.4 to 6.4 months, this is an OK market for the builders. They will build as long as new home sales are growing.
The builders will pull back on construction when the supply is 6.5 months and above.
The existing home sales market has 3.3 months of supply, so we have had a historical gap between new and existing monthly supply for some time now. However, since I started my housing economic work, this has been my rule of thumb:
The three-month average of monthly supply in the chart above is running at 8.6 months, and the monthly supply headline number did fall for the previous report. This data line has always been key to my work, which has run well with the builder’s confidence data that has gone into waterfall collapse mode, as you can see below. This data line is considered positive when it’s above 50 and currently at 33.
We are still in housing recession land as the builders still have a lot of new construction homes and haven’t started yet to build.
For the builders, 61,000 new homes are completed for sale, amounting to 1.2 months of the supply, and 298,000 new homes are still under construction, while 111,000 haven’t started. The last two data lines account for 7.7 months left in the data.So as you can see, we have a lot of homes that aren’t on the market from the 8.9 months of the supply. We can see why the builders are done building new single-family houses as they have a lot of work left to do ( Article Link). From Census: Sales Price The median sales price of new houses sold in October 2022 was $493,000. The average sales price was $544,000. This part of the new home sales data has confused many people per the last few reports because it is true we have hit an all-time high in median sales prices for new homes. Over the past month of social media, I have tried to convey this message about using median sales price data for the new home sales market. This data line can move highly one way or another based on the mix sale shift of prices. This means that getting a report that has an outsized of bigger homes sold can tilt the data aggressively higher.
Earlier in the year, when we saw a more significant percentage dip in median sales prices, this was due to having more smaller-sized homes in the sales mix. Just know that median sales price data always need to be taken with a grain of salt.
Another housing data line reported today was purchase application data, which scored its third straight week of growth, coming in at 3% week over week. That data is still down 41% year over year, but as I’ve said for many months now, the year-over-year comps were going to be very difficult starting from October to January. This means we should expect 35%-45% year-over-year declines to be the norm. Right on schedule, since October we have seen year over year declines range between 39%-46%.
The last time we had three straight weeks of growth in purchase apps was the middle part of June. I caution that we are working from historically low levels, so the bar is low, but after three weeks of growth — and seeing the year-over-year decline become less — this is something worth noting. We will continue to keep an eye on this, especially if mortgage rates head lower.
I understand that the new home sales reports have been confusing at times this year but remember that the trend is your friend. We are working from historically low sales levels, and the builders are pulling out all the stops to sell what homes they can while rates are high.
The new home sales sector improved significantly when mortgage rates dropped to 5%. However, for now, the monthly supply levels are still too high for the builders to start new construction, and we can see they have a lot of work to do with homes still under construction.
With purchase application data showing some life now after mortgage rates have dropped, 2023 is shaping up to be very interesting. For now, I hope you can enjoy the Thanksgiving holiday with your family and eat well!
https://frankbuysphilly.com/wp-content/uploads/2022/11/HW-row-of-houses.jpeg7001278Frank Buys Phillyhttps://frankbuysphilly.com/wp-content/uploads/2017/10/Bo-Final-Logo.pngFrank Buys Philly2022-11-23 21:27:552022-11-23 21:27:55Here’s why new home sales are up along with prices
15% ROI”,”imageURL”:”https:\/\/www.biggerpockets.com\/blog\/wp-content\/uploads\/2021\/05\/large_Extra_large_logo-1.jpg”,”imageAlt”:””,”title”:”SFR, MF & New Builds!”,”body”:”Invest in the best markets to maximize Cash Flow, Appreciation & Equity with a team of professional investors!”,”linkURL”:”https:\/\/renttoretirement.com\/”,”linkTitle”:”Contact us to learn more!”,”id”:”60b8f8de7b0c5″,”impressionCount”:”300436″,”dailyImpressionCount”:”939″,”impressionLimit”:”350000″,”dailyImpressionLimit”:”1040″},{“sponsor”:”The Entrust Group”,”description”:”Self-Directed IRAs”,”imageURL”:”https:\/\/www.biggerpockets.com\/blog\/wp-content\/uploads\/2021\/11\/TEG-Logo-512×512-1.png”,”imageAlt”:””,”title”:”Spring Into investing”,”body”:”Using your retirement funds. Get your step-by-step guide and learn how to use an old 401(k) or existing IRA to invest in real estate.\r\n”,”linkURL”:”https:\/\/www.theentrustgroup.com\/real-estate-ira-report-bp-awareness-lp?utm_campaign=5%20Steps%20to%20Investing%20in%20Real%20Estate%20with%20a%20SDIRA%20Report&utm_source=Bigger_Pockets&utm_medium=April_2022_Blog_Ads”,”linkTitle”:”Get Your Free Download”,”id”:”61952968628d5″,”impressionCount”:”523354″,”dailyImpressionCount”:”577″,”impressionLimit”:”600000″,”dailyImpressionLimit”:”1662″},{“sponsor”:”Walker & Dunlop”,”description”:” Apartment lending. Simplified.”,”imageURL”:”https:\/\/www.biggerpockets.com\/blog\/wp-content\/uploads\/2022\/03\/WDStacked512.jpg”,”imageAlt”:””,”title”:”Multifamily Property Financing”,”body”:”Are you leaving money on the table? Get the Insider\u0027s Guide.”,”linkURL”:”https:\/\/explore.walkerdunlop.com\/sbl-financing-guide-bp-blog-ad”,”linkTitle”:”Download Now.”,”id”:”6232000fc6ed3″,”impressionCount”:”190764″,”dailyImpressionCount”:”563″,”impressionLimit”:”200000″,”dailyImpressionLimit”:”6500″},{“sponsor”:”SimpliSafe Home Security”,”description”:”Trusted by 4M+ Americans”,”imageURL”:”https:\/\/www.biggerpockets.com\/blog\/wp-content\/uploads\/2022\/09\/yard_sign_100x100.png”,”imageAlt”:””,”title”:”Security that saves you $”,”body”:”24\/7 protection against break-ins, floods, and fires. SimpliSafe users may even save up to 15%\r\non home insurance.”,”linkURL”:”https:\/\/simplisafe.com\/pockets?utm_medium=podcast&utm_source=biggerpockets&utm_campa ign=2022_blogpost”,”linkTitle”:”Protect your asset today!”,”id”:”624347af8d01a”,”impressionCount”:”160778″,”dailyImpressionCount”:”637″,”impressionLimit”:”200000″,”dailyImpressionLimit”:”2222″},{“sponsor”:”Delta Build Services, Inc.”,”description”:”New Construction in SWFL!”,”imageURL”:”https:\/\/www.biggerpockets.com\/blog\/wp-content\/uploads\/2022\/04\/Image-4-14-22-at-11.59-AM.jpg”,”imageAlt”:””,”title”:”Build To Rent”,”body”:”Tired of the Money Pits and aging \u201cturnkey\u201d properties? Invest with confidence, Build To\r\nRent is the way to go!”,”linkURL”:”https:\/\/deltabuildservicesinc.com\/floor-plans-elevations”,”linkTitle”:”Look at our floor plans!”,”id”:”6258570a45e3e”,”impressionCount”:”144857″,”dailyImpressionCount”:”481″,”impressionLimit”:”160000″,”dailyImpressionLimit”:”2163″},{“sponsor”:”RentRedi”,”description”:”Choose The Right Tenant”,”imageURL”:”https:\/\/www.biggerpockets.com\/blog\/wp-content\/uploads\/2022\/05\/rentredi-logo-512×512-1.png”,”imageAlt”:””,”title”:”Best App for Rentals”,”body”:”Protect your rental property investment. Find & screen tenants: get full credit, criminal, and eviction reports.”,”linkURL”:”http:\/\/www.rentredi.com\/?utm_source=biggerpockets&utm_medium=paid&utm_campaign=BP_Blog.05.02.22&utm_content=button&utm_term=findtenants”,”linkTitle”:”Get Started Today!”,”id”:”62740e9d48a85″,”impressionCount”:”128901″,”dailyImpressionCount”:”490″,”impressionLimit”:”150000″,”dailyImpressionLimit”:”5556″},{“sponsor”:”Avail”,”description”:”#1 Tool for Landlords”,”imageURL”:”https:\/\/www.biggerpockets.com\/blog\/wp-content\/uploads\/2022\/06\/512×512-Logo.png”,”imageAlt”:””,”title”:”Hassle-Free Landlording”,”body”:”One tool for all your rental management needs — find & screen tenants, sign leases, collect rent, and more.”,”linkURL”:”https:\/\/www.avail.co\/?ref=biggerpockets&source=biggerpockets&utm_medium=blog+forum+ad&utm_campaign=homepage&utm_channel=sponsorship&utm_content=biggerpockets+forum+ad+fy23+1h”,”linkTitle”:”Start for FREE Today”,”id”:”62bc8a7c568d3″,”impressionCount”:”83784″,”dailyImpressionCount”:”562″,”impressionLimit”:0,”dailyImpressionLimit”:”1087″},{“sponsor”:”Steadily”,”description”:”Easy landlord insurance”,”imageURL”:”https:\/\/www.biggerpockets.com\/blog\/wp-content\/uploads\/2022\/06\/facebook-business-page-picture.png”,”imageAlt”:””,”title”:”Rated 4.8 Out of 5 Stars”,”body”:”Quotes online in minutes. Single-family, fix n\u2019 flips, short-term rentals, and more. Great prices and discounts.”,”linkURL”:”http:\/\/www.steadily.com\/?utm_source=blog&utm_medium=ad&utm_campaign=biggerpockets “,”linkTitle”:”Get a Quote”,”id”:”62bdc3f8a48b4″,”impressionCount”:”79718″,”dailyImpressionCount”:”489″,”impressionLimit”:”300000″,”dailyImpressionLimit”:”1627″},{“sponsor”:”MoFin Lending”,”description”:”Direct Hard Money Lender”,”imageURL”:”https:\/\/www.biggerpockets.com\/blog\/wp-content\/uploads\/2022\/06\/mf-logo@05x.png”,”imageAlt”:””,”title”:”Flip, Rehab & Rental Loans”,”body”:”Fast funding for your next flip, BRRRR, or rental with MoFin! Close quickly, low rates\/fees,\r\nsimple process!”,”linkURL”:”https:\/\/mofinloans.com\/scenario-builder?utm_source=biggerpockets&utm_medium=cpc&utm_campaign=bp_blog_july2022″,”linkTitle”:”Get a Quote-EASILY!”,”id”:”62be4cadcfe65″,”impressionCount”:”85387″,”dailyImpressionCount”:”347″,”impressionLimit”:”100000″,”dailyImpressionLimit”:”3334″},{“sponsor”:”REI Nation”,”description”:”Premier Turnkey Investing”,”imageURL”:”https:\/\/www.biggerpockets.com\/blog\/wp-content\/uploads\/2022\/07\/REI-Nation-Updated-Logo.png”,”imageAlt”:””,”title”:”Fearful of Today\u2019s Market?”,”body”:”Don\u2019t be! REI Nation is your experienced partner to weather today\u2019s economic conditions and come out on top.”,”linkURL”:”https:\/\/hubs.ly\/Q01gKqxt0 “,”linkTitle”:”Get to know us”,”id”:”62d04e6b05177″,”impressionCount”:”78260″,”dailyImpressionCount”:”408″,”impressionLimit”:”195000″,”dailyImpressionLimit”:”6360″},{“sponsor”:”Zen Business”,”description”:”Start your own real estate business”,”imageURL”:”https:\/\/www.biggerpockets.com\/blog\/wp-content\/uploads\/2022\/07\/512×512-1-300×300-1.png”,”imageAlt”:””,”title”:”Form Your Real Estate LLC or Fast Business Formation”,”body”:”Form an LLC with us, then run your real estate business on our platform. BiggerPockets members get a discount. “,”linkURL”:”https:\/\/www.zenbusiness.com\/p\/biggerpockets\/?utm_campaign=partner-paid&utm_source=biggerpockets&utm_medium=partner&utm_content=podcast”,”linkTitle”:”Form your LLC now”,”id”:”62e2b26eee2e2″,”impressionCount”:”60459″,”dailyImpressionCount”:”368″,”impressionLimit”:”80000″,”dailyImpressionLimit”:”2581″},{“sponsor”:”Marko Rubel “,”description”:”New Investor Program”,”imageURL”:”https:\/\/www.biggerpockets.com\/blog\/wp-content\/uploads\/2022\/07\/DisplayAds_Kit_BiggerPockets_MR.png”,”imageAlt”:””,”title”:”Funding Problem\u2014Solved!”,”body”:”Get houses as low as 1% down, below-market interest rates, no bank hassles. Available on county-by-county basis.\r\n”,”linkURL”:”https:\/\/kit.realestatemoney.com\/start-bp\/?utm_medium=blog&utm_source=bigger-pockets&utm_campaign=kit”,”linkTitle”:”Check House Availability”,”id”:”62e32b6ebdfc7″,”impressionCount”:”110249″,”dailyImpressionCount”:”419″,”impressionLimit”:”200000″,”dailyImpressionLimit”:”1858″},{“sponsor”:”Xome”,”description”:”Search & buy real estate”,”imageURL”:”https:\/\/www.biggerpockets.com\/blog\/wp-content\/uploads\/2022\/08\/BiggerPocket_Logo_512x512.png”,”imageAlt”:””,”title”:”Real estate made simple.”,”body”:”Now, you can search, bid, and buy property all in one place\u2014whether you\u2019re a seasoned\r\npro or just starting out.”,”linkURL”:”https:\/\/www.xome.com?utm_medium=referral&utm_source=BiggerPockets&utm_campaign=B P&utm_term=Blog&utm_content=Sept22″,”linkTitle”:”Discover Xome\u00ae”,”id”:”62fe80a3f1190″,”impressionCount”:”45204″,”dailyImpressionCount”:”537″,”impressionLimit”:”50000″,”dailyImpressionLimit”:”1667″},{“sponsor”:”Follow Up Boss”,”description”:”Real estate CRM”,”imageURL”:”https:\/\/www.biggerpockets.com\/blog\/wp-content\/uploads\/2022\/08\/FUB-Logo-512×512-transparent-bg.png”,”imageAlt”:””,”title”:”#1 CRM for top producers”,”body”:”Organize your leads & contacts, find opportunities, and automate follow up. Track everything and coach smarter!”,”linkURL”:”https:\/\/pages.followupboss.com\/bigger-pockets\/%20″,”linkTitle”:”30-Day Free Trial”,”id”:”630953c691886″,”impressionCount”:”48516″,”dailyImpressionCount”:”667″,”impressionLimit”:”150000″,”dailyImpressionLimit”:”1230″},{“sponsor”:”Walker & Dunlop”,”description”:”Loan Quotes in Minutes”,”imageURL”:”https:\/\/www.biggerpockets.com\/blog\/wp-content\/uploads\/2022\/09\/WD-Square-Logo5.png”,”imageAlt”:””,”title”:”Skip the Bank”,”body”:”Financing $1M – $15M multifamily loans? Competitive terms, more certain execution, no strings to personal assets”,”linkURL”:”https:\/\/explore.walkerdunlop.com\/better-than-banks\/bigger-pockets\/blog\/quote”,”linkTitle”:”Learn More”,”id”:”6318ec1aeffc3″,”impressionCount”:”58429″,”dailyImpressionCount”:”601″,”impressionLimit”:”200000″,”dailyImpressionLimit”:”2334″},{“sponsor”:”Nada”,”description”:”New way to own real estate”,”imageURL”:”https:\/\/www.biggerpockets.com\/blog\/wp-content\/uploads\/2022\/10\/Nada-512-logos_Artboard-2.png”,”imageAlt”:””,”title”:”Start investing today”,”body”:”Cityfunds makes it possible for any investor to buy & sell fractions of a\r\ncity\u2019s real estate market with just $250″,”linkURL”:”http:\/\/www.nada.co\/biggerpockets”,”linkTitle”:”Get the Nada Finance App”,”id”:”6348763e299ad”,”impressionCount”:”11376″,”dailyImpressionCount”:”706″,”impressionLimit”:”50000″,”dailyImpressionLimit”:”2273″},{“sponsor”:”Kiavi NMLS ID #1125207″,”description”:”Hard Money the Easy Way”,”imageURL”:”https:\/\/www.biggerpockets.com\/blog\/wp-content\/uploads\/2022\/11\/kiavi_logo_for_bigger_pockets.png”,”imageAlt”:””,”title”:”Reliable Capital for REIs”,”body”:”Scale your real estate investment portfolio with high leverage, quick-to-close loans, and an easy lending platform.”,”linkURL”:”https:\/\/www.kiavi.com\/biggerpockets?utm_source=biggerpockets&utm_medium=content%20partner&utm_campaign=blog&m_mdm=content%20partner&m_src=biggerpockets&m_cpn=blog&m_prd=direct&m_fs=lead&m_ct=html&m_t=promo&m_cta=get%20started “,”linkTitle”:”Get Started with Kiavi”,”id”:”636d70737a1ed”,”impressionCount”:”7423″,”dailyImpressionCount”:”864″,”impressionLimit”:”50000″,”dailyImpressionLimit”:”1087″}])” class=”sm:grid sm:grid-cols-2 sm:gap-8 lg:block”>
https://frankbuysphilly.com/wp-content/uploads/2022/11/washington-dc-1024x517.jpg5171024Frank Buys Phillyhttps://frankbuysphilly.com/wp-content/uploads/2017/10/Bo-Final-Logo.pngFrank Buys Philly2022-11-22 04:45:122022-11-22 04:45:12Washington, D.C. Real Estate Market—Stats And Trends In 2022
Amid surging rates, declining volumes and a reduced appetite from investors in the secondary market, there are a growing number of casualties in the mortgage space, especially in the riskier non-QM segment.
But right when several companies are turning away from non-QM products, a Colorado-based lender has decided to launch a new division to cater to this market. The question is: why?
Stronghill Capital – a small-balance commercial lender owned by the $20 billion-plus asset management firm ArrowMark Partners – announced last week it had launched a new residential lending division to provide borrowers with non-QM products, non-agency jumbos and investor programs.
“Probably it seems very counterintuitive when companies are running away from the flames in the fire, to see a company like ours making an announcement that we are going to go full bore running into the fire,” Dustin Wells, recently appointed as the co-president at Stronghill Capital, told Housingwire.
Stronghill, however, is no stranger to the non-agency and investor loan space.
The company sells loans via brokers for clients – usually LLCs, C-corps or S-corps – to acquire residential real estate for commercial and investment purposes. Now, business owners can also apply for a mortgage loan as an individual.
“So, for example, if I’m a business owner working with a brokerage to buy five investment properties that I’m going to invest in my LLC, but I also want to buy a new primary residence or a second home, now we can be that one-stop-shop for this client,” he explained.
According to Wells, Stronghill originates about $500 million a year to real estate investors, employing about 30 staff members, and has “trusted partnerships with warehouse providers in the space to provide credit facilities to fund loans on an ongoing basis.”
With surging rates, lenders are struggling to sell legacy lower-rate loans originated months ago in the secondary market as investors seek higher yields. This liquidity problem caused the implosion of non-QM lenders, but Wells said that by entering the market now, Stronghill “fortunately don’t have any legacy issues like these companies.”
The company, which operates in wholesale and delegated and non-delegated correspondent channels, will outsource most of the back office work for the new division.
Wells said Stronghill is not competing with wholesale lenders with aggressive pricing, like United Wholesale Mortgage or Homepoint. He said Stronghill’s brokers deal with more “esoteric” cases, while these companies are “built on scalability through simplicity.” Consequently, Deephaven and Angel Oak would be the natural competitors.
Stronghill has licenses in five states for the new division – Arizona, Colorado, Florida, South Carolina and Texas – but is working on getting 44 licenses in total.
Looking forward, Wells said the new division will grow according to, among other things, the Federal Reserve funds rate.
“We’re saying somewhere between $400 million and $500 million is our projection for the residential consumer space heading into next year. And then, depending on where things track in 2023, we could see exponential growth into 2024,” Wells said.
Despite higher rates, Wells said borrowers are looking at purchase loans because there is currently less competition for houses compared to the past two years.
“Now, you might be paying a higher rate, but you’re able to negotiate on those properties and can work through getting a lower rate in the future,” he said. “But right now, the focus is: Can I get the house at the right price, whereas before, was I going to pay too much?”
https://frankbuysphilly.com/wp-content/uploads/2022/11/house-on-fire-1.jpg7001200Frank Buys Phillyhttps://frankbuysphilly.com/wp-content/uploads/2017/10/Bo-Final-Logo.pngFrank Buys Philly2022-11-21 22:51:312022-11-21 22:51:31Why this small lender is running straight into the non-QM fire
If you are like me, I suspect you’ve heard a good number of gurus, or even seasoned, well-meaning investors, give the following advice in some form or fashion:
“Systems and policies are essential. If you want a business that works, you need to have systems and policies. You need to have those systems and policies, and you need to follow those systems and policies because systems and policies are absolutely essential to have and follow. Systems and policies!”
While it is certainly true that systems and policies are extremely important as I will elaborate on further shortly. Of course, just saying that isn’t particularly helpful. The “how” part is often missing, unfortunately. So, in this article, I will at least sketch out an outline of how to approach building systems and policies for real estate investors.
Why Systems and Policies Are So Important
First and foremost, the reason systems and policies are so important is because it’s a massive waste of time and energy to simply reinvent the wheel over and over again. Indeed, even the simple act of making decisions can be exhausting, and so if there is a solution ready to go for a given problem (i.e. a system or a policy), you can execute that solution with little thought and devote your mental energy to something else.
Systems also make it easier to delegate tasks, as employees and contractors won’t have to continually ask for directions. They also allow you to maintain quality control and standardize outcomes throughout the various parts of your business. Furthermore, they make it easier to stay on the right side of the law as treating someone (particularly a prospective or actual tenant) differently than another one could amount to a violation of Fair Housing.
But the most important reason for systems and policies, at least in this author’s humble opinion, is that they lay the groundwork to scale your business. It’s important to remember scaling is not growth. Instead, scaling is what facilitates growth. Investopedia defines it as follows,
“Scalability refers to the ability of an organization (or a system, such as a computer network) to perform well under an increased or expanding workload. A system that scales well will be able to maintain or increase its level of performance even as it is tested by larger and larger operational demands.”
Growth for the sake of growth is the philosophy of cancer, which, left unabated, will eventually kill its host (the business). Only through scaling (which relies on systems and policies) can the foundation be laid to “maintain or increase” the “level of performance even as it is tested by larger and larger operational demands.”
Only through scaling can you truly and sustainably grow a business. And even if you don’t want to grow that much, systems and policies will make your life a whole lot easier, shrink your liability and increase your profits.
The Key Point To Remember
I can’t think of anyone who has actually said this, but I do think there is an underlying assumption that many entrepreneurs believe you build your systems, and then you build your business. Or perhaps, you start off by building your business by going from one whim to the next, and then you realize you need systems, so you add those, and then you go back to building your business.
If I could ensure that this article accomplishes one thing, it would be to permanently remove this idea from your mind.
Business does not work in such a sequential manner. Instead, you should be building your systems and policies in lockstep with your business. It’s an iterative and never-ending process. As you expand your business, you should be expanding and updating your systems and policies. It never ends. Don’t expect it to.
Learning and Borrowing From Others
Of course, that doesn’t mean you need to start from scratch and feel your way through the dark to only learn from hard-fought (and expensive) experience.
There are plenty of good sources to learn from, including here at BiggerPockets. You should be regularly reading articles (on real estate and business in general), reading books, listening to podcasts like the BiggerPockets Real Estate podcast, and attending meetups and conferences. You should definitely be involved at your local Real Estate Investors Association or BiggerPockets meetup groups and ask seasoned investors about their various systems. Trust me, people love to talk about themselves. They’ll open up.
There are also four books, in particular, I would recommend reading when it comes to systems and policies. Any business owner should read through these:
This book outlines the importance of thinking of your business like a franchise owner would, creating the policies that could be handed to someone else in another market to replicate.
Gawande highlights the incredible improvement all sorts of organizations have made by simply having and following checklists for recurrent tasks. You should definitely start making these. We have developed checklists for creating scopes of work, screening residents, moveouts and deposit disposition, analyzing properties, due diligence, and financing properties, etc. Having these and following them dramatically reduces mistakes and oversights.
Wickman goes over creating an EOS (Entrepreneurial Operating System) that covers every part of your business and then hones and streamlines them as best as possible.
Harnish might as well take the torch from where Wickman leaves off when it comes to scaling. He particularly highlights the importance of creating key performance indicators (KPIs) to monitor and improve performance throughout your company.
As a bonus, I would also add Getting Things Done by Gary Allen to systematize your own life.
Of course, if you are a new investor, you don’t need to read all of these before you get started. But I would definitely get on reading them as soon as possible.
Laying the Groundwork
As soon as you can, you want to start building systems, even if that’s before you get started. (Although you should not use a lack of systems as an excuse to procrastinate, again, building systems is a never-ending process.)
You should start by identifying your core processes. As Gino Wickman notes in Traction,
“It’s surprising how productive this step is. This exercise creates clarity of thought that is then put down in black and white…just by calling your processes by a consistent name, you reduce complexity and increase efficiency in the organization.”
So, for example, in our business, we have the following core processes. Yours will likely be a bit different, but this should make it clear what you are aiming for.
Acquisition
Financing (private loans upfront)
Refinancing (bank loans on the back end)
Accounting
Rehab
Turnover
Property Management
Maintenance
Human Resources (hiring, firing, etc.)
We have then blocked these into several departments. So, I oversee acquisition and refinancing. My brother oversees human resources and assists in acquisition, and my dad is in charge of finding private lenders (financing). Thus, in our main office, we have four other departments that report to us:
Property management
Maintenance
Rehab and Turnover
Accounting
I don’t have the space here to go over each component of each department, so we’ll hyperfocus on one aspect to give a general idea. In this case, we’ll look at how a typical turnover is handled through the property management and rehab departments.
Our process is as follows, with the department in charge noted in parenthesis.
Visit the property and evaluate condition and damages (Rehab)
Create a scope of work for repairs during the same visit (Rehab)
Do a deposit disposition based on damages noted (Management)
Send that scope of work to one or more contractors (Rehab)
Evaluate the bids and make a decision (Rehab)
Verify work is completed and take marketing pictures (Rehab)
List property (Management)
This process requires several checklists and policies embedded within it. For example, we have a scope of work template in Excel for writing up scopes. We have a bid template in Smartsheet we send out to contractors. We have a deposit disposition template as well as a master availability list that shows everyone in the organization where things are at as the property proceeds from the management department to the rehab department and back.
Some of these templates are available free of charge. BiggerPockets itself has a long list of landlord forms, including applications and leases you can get for free. If you are a real estate agent, your brokerage and the MLS should also have such forms.
Find an Agent in Minutes
Match with an investor-friendly real estate agent who can help you find, analyze, and close your next deal.
Streamline your search.
Tap into a trusted network.
Leverage market and strategy expertise.
As you standardize your processes, you should also standardize your materials. Use the same paint colors (or just a few), vinyl, countertops, appliances, etc., for your rehabs and turnovers. This will make it simpler to acquire and replace these items and also make it more likely you can simply make repairs or do a touch-up rather than a full replacement.
Now, this probably sounds like a lot. It is. You may be just starting, and the idea of having departments could sound ludicrous to you. That’s completely understandable. It was how I would have felt not too long ago. Remember, building systems is an iterative process. Build your systems for you in the meantime, and soon enough, you will be hiring others who you will want to make sure to follow those very same systems. Trust me, you will need to be continuously building and changing your systems and policies as you grow.
Indeed, we have a whole smorgasbord of old Google sheets and Word documents in what we refer to as the “Google Docs Graveyard” meandering about the cyberspace. There will be plenty of false starts and curveballs no matter how well laid your plans are.
The Iterative Process of Building Systems and Making Policies
Again, there’s only so much you can do upfront. As you go, you will run into all sorts of problems that you hadn’t thought of nor planned for. These unique problems, however, are great opportunities to systematize your business.
Indeed, with each new decision you make, you should attempt to create a system or policy out of that. Don’t just fly by the seat of your pants as problems get thrown at you. Yes, it takes more time in the beginning to systematize and/or create policies. But this is a Quadrant II activity (important but not urgent), as Stephen Covey discussed in his classic book The Seven Habits of Highly Effective People. These are the tasks that reduce the amount of time you need to spend on such issues going forward.
These Quadrant II tasks “maintain or increase” the “level of performance even as [your company] is tested by larger and larger operational demands.”
These Quadrant II tasks are the ones you need to prioritize.
To give you an idea of how this works, here are a few examples we have had to deal with and the solution we have come up with:
Problem 1: Cockroach infestation at a house three weeks after a tenant moves in.
Policy Solution: If infestation is within the first month of tenancy, it’s on us (they were likely there when the tenants moved in), afterwards, the cost is on the tenant.
Problem 2: Tenant constantly pays late, clogging up management resources.
Policy: Allow for one payment plan per year. Afterward, an eviction notice will be filed, and the tenant will either need to pay the whole balance or set up a time to leave.
Problem 3: A maintenance order takes way too long, and it was our fault.
Policy: In such cases (when it’s not so egregious, we would consider a rent discount), we offer a gift card to their favorite restaurant (which we ask for when they sign the lease) to smooth things over.
Of course, not everything can be systematized or made into a policy. On a recent portfolio purchase, a tenant gave notice to leave to the seller while we were under contract. Their lease, however, went for another six months. The seller had been soft about enforcing lease terms, so the tenant thought it would be fine. And they just got a house under contract to buy and couldn’t afford both the mortgage and the lease. In this case, we asked the seller to prepay two months of their rent, and we would call it good and let the tenant out of their lease. He agreed.
You can’t really create a policy for such a specific situation, but you can for many. And you can create broad outlines of how to respond to really unique circumstances (i.e. if, while under contract, the seller wants to let a tenant out of their lease, we expect to be compensated for it). So, while it’s impossible to cover every scenario, and you certainly need to leave room for flexibility when it comes to many decisions, you can still systematize and make policies for a lot of ground.
And that will go a long way to scale your business and facilitate future growth (and continued sanity).
Key Performance Indicators
As you go, you will want to start developing KPIs for each major area of your business. Broad indicators for your company are pretty simple and should include things like:
Gross Income
Net Income (after operating expenses)
Cash Flow (after debt service)
Change in Income Year over Year
Occupancy Rate
Delinquency Rate
Units Bought this year
But these indicators are very broad and don’t tell you a lot about why things are the way they are. Thereby, you also want to nail down KPIs for managers, or in the high likelihood that you don’t have managers, departments, or areas of your business.
While it’s true that you may not know whether the number you get with any given KPI is good or bad, you know what’s better and what’s worse. So you know which direction things are going and also have something to aim for, which clarifies your (or your manager’s) goals.
Here are some examples that we track for different departments:
Acquisition
Properties Acquired
Units Acquired
Average All-in Price per Property
Average ARV
Rehab Estimate
Rehab Actual/Rehab Estimate
Turnover
Total Rolling Days of All Properties in Turnover (at end of the month)
Average Days from Possession to a Finished Scope (for month)
Average Days from a Finished Scope to Market Ready (for month)
Projects Completed that Month
Average Cost of Turnover
Property Management
Deposits in Month
Deposits Minus Moveouts
Percent of Potential Rent Collected (i.e., delinquency)
Lease Renewal Percentage
Occupancy Percentage
Average Rent Increase
Total Rolling Days of Properties Available for Lease on Market (at end of the month)
Maintenance
Closed Work Orders (in month)
Work Orders Outstanding/Closed Work Orders
Average Time to Complete Work Order (in that month)
Number of Work Orders that took Longer than 48 Business Hours to Visit
Call Back Percentage
Those are, of course, just what we do. Yours don’t have to be the same. But they do give you a good idea of how things are going. And while monthly anomalies shouldn’t be surprising (particularly with things like “Average Cost of Turnover”), these aberrations should work themselves out over the long run and give you a good idea of how things are going.
And if you do have managers, they are a great way to evaluate their job performance without micromanaging or blindly trusting them.
One last note here, in order to track your KPIs effectively, you need to have quality accounting. In addition, in order to sell at top prices and get banks to lend to you or just know whether you’re solvent, it’s critical to have your accounting in order. This is not something to skimp on. Make accounting a priority and either learn accounting or, better yet, outsource or hire someone capable of doing it.
I can’t tell you how many times I’ve seen small investors selling a property with horrible accounting. Such a state of affairs not only reduces the value of their asset but it makes it all but impossible to scale.
Conclusion
Systems and policies are essential for scaling, and scaling is essential for growth. But again, the biggest takeaway here is not just that systems and policies are good and necessary, it’s that building them is an iterative process that never ends.
Don’t be scared or overwhelmed by the thought of them. Every entrepreneur starts with zero systems in the same way every real estate investor starts with zero properties. But in the same way, you don’t intend to stay at zero properties, you should intend to grow your systems alongside your company. Back forth, around and around, forever and ever.
Find financial freedom through rentals
If you’re considering using rental properties to build wealth, this book is a must-read. With nearly 400 pages of in-depth advice for building wealth through rental properties, The Book on Rental Property Investing imparts the practical and exciting strategies that investors use to build cash flow and wealth.
Note By BiggerPockets: These are opinions written by the author and do not necessarily represent the opinions of BiggerPockets.
https://frankbuysphilly.com/wp-content/uploads/2022/11/business-systems-1024x517.jpg5171024Frank Buys Phillyhttps://frankbuysphilly.com/wp-content/uploads/2017/10/Bo-Final-Logo.pngFrank Buys Philly2022-11-19 04:44:302022-11-19 04:44:30How To Build Effective Systems In Your Real Estate Business
The National Association of Realtors (NAR) reported today on two trends in existing home sales that we have seen for many months now: sales are declining while total inventory data has fallen directly for the three straight months. On a positive note, however, the days on the market are no longer a teenager anymore: that metric grew from 18 days to 21 days.
I cheer because the savagely unhealthy housing market theme I talked about back in February of this year was the same premise of the housing reset talking point the Federal Reserve uses. Total inventory data started at all-time lows at the beginning of 2022, creating more bidding war action in January and February, peaking in March.
We needed to end this madness before we had prices escalate over 20% for another year. The Federal Reserve wanted to see the bidding wars end and the days on the market grow. This is happening, and in the long run, this is a plus for the housing market.
When I outlined my 23% five-year growth model for 2020-2024, it was to have a marker for when price growth got too hot. I didn’t have to worry about this in the previous expansion — as my long-term work stated for a decade, the years 2008-2019, would have the weakest housing recovery ever.
We don’t have any housing bubble or overheated demand data, nor can we. This article, which I wrote in 2019, does show you the historical work in the past decade on the housing bubble talk.
However, I knew the years 2020-2024 would see better demand from the bump in demographics. This could potentially put us in a horrible place with inventory, which it did, and prices accelerated beyond my five-year price-growth model in just two years. I am staying consistent with my work and model when I described the housing market in February as savagely unhealthy.
Soon after, the Fed came in with their housing reset premise. Now we are getting the call back to balance, which is good. The positive aspect of today’s data line is that the days on the market grew again, and we are getting off the teenager level.
NAR Research: First-time buyers were responsible for 28% of sales in October; All-cash sales accounted for 26%; Individual investors purchased 16%; Distressed sales represented 1% of sales; Properties typically remained on the market for 21 days in October.
One thing about housing data we all need to be mindful of is that the year-over-year comps will be very challenging until we get to the end of January. Last year starting in October, purchase application data had an abnormal volume rise toward the end of the year. Even though the data was still showing negative year-over-year prints due to COVID-19 comps, the percentage was getting less and volumes were growing.
It was a funky time with housing data last year; people needed to make COVID-19 comp adjustments. As mortgage rates rose more and more, the October to January data was going to show big negative prints.
NAR Research: Total existing-home sales decreased 5.9% from September to a seasonally adjusted annual rate of 4.43 million in October. Year-over-year, sales dropped by 28.4% (down from 6.19 million in October 2021).
I anticipated purchase application data to have 35% to 45% year-over-year declines starting in October. That has occurred right on schedule; the last print came down 46%. If housing data takes another leg lower, we would see negative prints of 53%-57%. The last two weeks have had positive weekly data of +1% and +4%.
Total housing inventory fell in this report, the third report in a row that shows total inventory has decreased. Seasonal impacts are the norm with housing, and new listing data is negative 6% year to date.
We saw new listing data decline when rates got to 6.25% the first time. This is not a positive for the housing market. A traditional seller is primarily a homebuyer, so not only do we lose the inventory for sale when this happens, but we also lose a buyer. This is another factor in driving purchase application data below 2008 levels. However, as we can see, the inventory data looks much different than what we saw in 2000, 2005, 2008, 2012, 2015 and 2018.
NAR lists the currentinventory at 1.22 million, while historical normals are between 2 million to 2.5 million, with a peak in 2007 a tad over 4 million. The monthly supply grew from 3.2 months to 3.3 months.
Price growth has been cooling off more noticeably, similar to other periods when mortgage rates rose. However, the extreme level of price growth we had earlier this year was savagely unhealthy, so this news isn’t just welcome — it’s needed to bring balance back.
NAR Research: The median existing-home price for all housing types in October was $379,100, a gain of 6.6% from October 2021 ($355,700), as prices rose in all regions.
With today’s report, we see the continued trend of demand destruction from higher rates and a lack of new listing growth. The severely unhealthy housing market is returning to a B&B marketplace, boring and balanced, but still needs more time.
The parts of the country at 2019 inventory levels are already off my savagely unhealthy list; the rest are still struggling to get more new active listings. The Federal Reserve can help the housing market by saying one sentence about the pivot; however, it’s not there yet, and housing market inflation is their big concern.
Going out for next year, though, the rent inflation data is lagging on the CPI data and is already showing a cooldown. We see the inflation growth rate falling in other data lines as well.
If mortgage rates can get down toward 5%, we can see some stabilizing in the housing data that is working from a much lower bar now. This is the way to get out of the housing recession that started in June.
The best way to fight inflation is to add more supply, and when I look at the housing completion data for the past two years, it just makes me want to puke. In previous expansions, builders’ housing completion data would move in line with housing starts and permits. However, for the first time in recent modern-day history — due to supply chain issues and other factors — housing completion data has lagged behind housing permits and starts.
It simply has taken too long to build homes to full completion over the last several years. At different times we’ve seen homes that were mostly finished but had no garage doors, or were waiting on windows or appliances. For this reason, the number of housing units “under construction” is the largest ever recorded in history because they were taking so long to finish.
For the builders, they have a new problem: they had homes under contract and then mortgage rates jumped in the biggest fashion ever recorded in history. So, cancelation rates are rising when the homes are finished and ready to move in. Given that, you can see why they are in no rush to finish or even start to build on homes in the pipeline.
At first, the backlog was simply a supply issue. Now, with mortgage rates so high, I believe there is less financial incentive for builders to start on the homes they haven’t begun to build yet. I personally wouldn’t do it. If the builders could, they would take some of the past contracts back, but they’re just stuck with these homes. Not everyone cancels their contracts, of course, but people are mindful of other people getting better deals.
Housing construction productivity has always been terrible compared to other sectors of our economy; I get that, as we still build homes with hammers and nails, not robots.
To give some numbers on the topic, the gap between housing completions data today versus the housing bubble peak is roughly 700,000 — almosthalf of the total completion data today. As you can see in the chart below, we had a nice, slow up-trend from 2002 to 2005 and here in the 2020 to 2022 timeframe, we haven’t gone anywhere much with total completion data. We need to push these homes onto the market to get inflation lower.
From Census: Housing Completions Privately owned housing completions in October were at a seasonally adjusted annual rate of 1,339,000. This is 6.4 percent (±10.6 percent)* below the revised September estimate of 1,431,000 but is 6.6 percent (±12.6 percent)* above the October 2021 rate of 1,256,000. Single-family housing completions in October were at a rate of 961,000; this is 8.3 percent (±8.2 percent) below the revised September rate of 1,048,000. The October rate for units in buildings with five units or more was 362,000.
As you can see from the data above, we have some work to do, and we have 928,000 2-unit housing under construction, the most since 1973. So, the best way to break shelter inflation down is to get more supply onto the market as soon as possible. This is why it’s frustrating to see the housing completion data look like it does. However, it’s also something that should be expected.
Housing starts
Housing Starts Privately owned housing starts in October were at a seasonally adjusted annual rate of 1,425,000. This is 4.2 percent (±12.7 percent)* below the revised September estimate of 1,488,000 and 8.8 percent (±12.7 percent)* below the October 2021 rate of 1,563,000. Single-family housing starts in October were at a rate of 855,000; this is 6.1 percent (±13.4 percent)* below the revised September figure of 911,000. The October rate for units in buildings with five units or more was 556,000.
Housing starts data has room to head lower as the new home sales sector still has way too much supply (from the builders’ perspective) to even consider building more single-family housing. The builders’ business model is to not ever oversupply a marketplace, so they’re right to halt all new construction until the supply of single-family homes goes lower through more new home sales.
My rule of thumb for anticipating builder behavior is based on the three-month average of supply. This also has nothing to do with the existing home sales market, this monthly supply data is only for the new homes sales market.
When supply is 4.3 months and below, this is an excellent market for builders.
When supply is 4.4 to 6.4 months, this is an OK market for the builders. They will build as long as new home sales are growing.
The builders will pull back on construction when the supply is 6.5 months and above.
We currently have 9.2 months of supply, and we will get an update on this data line next week, as the new home sales report will show that the builders are still struggling to sell more homes with higher rates. Mortgage rates getting back to 5% would solve some of their issues, but above 7% is problematic.
Rates have come down from their recent highs and we did see a pick-up in the weekly purchase application data with back-to-back positive weeks. However, we still have a lot of work here to bring supply lower.
We can easily see this in the builders’ confidence data, which has collapsed almost back to the lows of COVID-19. In March of this year, I wrote how the business model for the builders was at risk as the 10-year yield broke over my critical level of 1.94%. In June, I declared the housing market in a recessionand since then, the builders’ confidence data has had a waterfall collapse back toward the 33 levels.
Housing permits Building Permits Privately-owned housing units authorized by building permits in October were at a seasonally adjusted annual rate of 1,526,000. This is 2.4 percent below the revised September rate of 1,564,000 and is 10.1 percent below the October 2021 rate of 1,698,000. Single-family authorizations in October were at a rate of 839,000; this is 3.6 percent below the revised September figure of 870,000. Authorizations of units in buildings with five units or more were at a rate of 633,000 in October.
Housing permits for multifamily construction haven’t collapsed as badly as single-family housing, but I believe over time, this will occur as rent inflation fades. The real-time data on rents shows the cooling process is already significantly elevated. This is something to keep track of for next year because losing both single-family and multifamily construction at the same time will drive housing permits much lower than where we are now.
With all that said, we can see the struggles that the builders are having, however, we can also clearly see that the builders are in a much better spot to deal with this housing recession than at the peak of 2005.
Back in 2005, new home sales were so elevated from exotic loan debt structures that the collapse in sales was truly epic. It was a massive 82% decline in sales from the peak of 2005 to the housing crash lows. Now, the builders aren’t dealing with such an elevated level of sales, so they can work on getting rid of their excess supply with much less market stress.
Also, a huge difference for the builders now is that they’re dealing with less competition. Back in 2007, we had over 4 million housing units for sale with crushing demand. The builders were in a terrible position as their product wasn’t where the dollars were going. New homes are always more expensive than older cheaper existing inventory so the builders are mindful of the competition.
Now over time, as active listings grow, they will take notice as they did in the previous expansion. However, if we are talking about the housing bubble crash versus now, they’re in a much better situation to deal with this housing recession.
Existing home sales are coming up tomorrow and in the last report, the total inventory level was 1.25 million.
With that said, we all need to hope that the builders can get the wave of multifamily construction onto the market for next year to drive rent inflation lower and lower. That will be a plus for mortgage rates, which can get us out of the housing recession. As you can see from today’s report, we aren’t there yet, but we have the supply coming!
Between the shift towards self-employment and the number of Millennials entering the housing market, the market for non-QM is poised for substantial growth in the year to come. HousingWire recently spoke with John Keratsis, president and CEO of Deephaven Mortgage, about what lenders should be doing to capitalize on the boom in non-QM lending and why our preconceived notions about non-QM could be all wrong.
HousingWire: Why is now such an important time to prioritize non-QM?
John Keratsis: The timing to get into non-QM couldn’t be better for a couple of reasons. First, the non-QM market is poised for long-term, sustainable growth. This is a direct result of a monumental shift in the US to the self-employed workstyle. Contract or ‘gig’ workers, entrepreneurs and business owners need non-QM mortgages because they may be unable to produce the W-2 tax form used to verify qualifying income for a traditional loan.
Driving this workstyle change is the largest population cohort in US history: Millennials. As millions of self-employed Millennials settle down and start to raise families, they are looking for their first home. Millennials were born between 1982 and 2000. So, the Millennial homebuying demand is set to continue for a span of eighteen years!
Right behind the Millennials are the Gen Zers – the third largest population in US history. Gen Zers are also big on the self-employed workstyle. All of which means there will be a sustained demand for non-QM loans for many years to come.
Another reason to get into non-QM lending at this very moment is diversification. Just about every lender is looking for alternative revenue sources to offset the decline in refinances and the very tight purchase market. Offering non-QM loans provides access to those millions of borrowers who want mortgages but are unable to qualify for a traditional loan.
The timing is right from the capital markets perspective, too. Residential mortgage credit provides diversification benefits to institutional investors. Historically, RMBS have performed comparatively well during downturns in the stock market.
HW: How has the growing trend of self-employment led to the need for more robust non-QM products?
JK: Per above, it’s a perfect storm. Millennials, at 72.19 million are the largest population cohort in US history, are now settling down, starting families and looking for their first homes.
Millennials also make up a vast segment of the largest non-QM borrower cohort: the self-employed. Ironically, the pandemic put homeownership in closer reach for self-employed workers. By making it acceptable to work from anywhere, they are free to move around the country and purchase homes in more affordable geographies where it takes less time to save for the all-important down payment.
HW: Non-QM loans are surrounded by misconceptions. How can lenders debunk myths about non-QM lending? JK: The biggest misconception is that non-QM is only for borrowers who can’t qualify for a traditional loan due to poor credit. We’ve found that the best way to debunk this is to simply use the facts. In today’s non-QM loan pools, FICO scores can range between 730-740, DTIs generally meet Agency standards and LTVs are in the low 70s.
Beyond that, it’s important to point out that non-QM, like the traditional market, shifts and evolves with the industry. The rise of self-employed borrowers is one trend. Another is the demand for single-family rental properties. Even industry professionals are surprised to learn that business purpose DSCR (Debt Service Coverage Ratio) loans make up about 30% of our business. America’s aging housing stock is fueling this trend as property investors purchase single-family homes from downsizing baby boomers, fix them up and then use them to generate rental income. This is also another indication of how the non-QM sector continues to evolve to serve shifting industry trends. We have the flexibility to quickly align products and services with market demands, whereas the traditional mortgage market does not. Today, Deephaven can close a DSCR loan in as few as 15 days.
HW: What is Deephaven Mortgage doing to expand non-QM lending?
JK: We know the demand for non-QM loans will only keep growing. We know that investors, attracted by higher yields, want them on the capital markets side.
To a certain degree, we have to just keep doing what we’re already doing: 1) keep educating lenders, brokers, real estate agents and borrowers about non-QM mortgages; 2) continue to build out both wholesale and correspondent distribution channels; and 3) implement ongoing enhancements to our non-QM customer experience.
At Deephaven, we are continuously running webinars to bring new loan officers into the non-QM fold. We’re investing heavily in technology to create truly seamless service delivery. As demands grows, competition for non-QM loans will, too. The tiebreaker will become the borrower and client experience.
https://frankbuysphilly.com/wp-content/uploads/2022/11/Business-growth-3-e1668699497459.jpg6751138Frank Buys Phillyhttps://frankbuysphilly.com/wp-content/uploads/2017/10/Bo-Final-Logo.pngFrank Buys Philly2022-11-17 19:48:212022-11-17 19:48:21Finding growth opportunities in the non-QM space in 2023
Some lenders have experienced a spike in borrowers’ demand for mortgage loans following last week’s rate collapse due to softer inflation data. However, according to executives and loan officers, it’s too early to say that this marks a turning point in the shrinking mortgage market.
To illustrate how fast mortgage rates have declined, the 30-year fixed rate decreased this week to an average of 6.61%, down from last week’s 7.08%, according to the latest purchase mortgage survey from Freddie Mac. The same rates averaged 3.10% one year ago.
“Mortgage rates tumbled this week due to incoming data that suggests inflation may have peaked,” Sam Khater, Freddie Mac’s chief economist, said in a statement.
However, according to Khater, “while the decline in mortgage rates is welcome news, there is still a long road ahead for the housing market: inflation remains elevated, the Federal Reserve is likely to keep interest rates high and consumers will continue to feel the impact.”
Other executives echoed Khater’s sentiments.
“We’re seeing some relief,” Frank Capobianco, senior vice president at Cardinal Financial Company, said. “But many people are hesitant to say that this is the turning point until they see the December’s CPI numbers and the decision from the December’s Fed meeting.”
“J.R.” Samsing, vice president at Offerpad Home Loans, agreed, stating that “unfortunately,” the market has not reached a turning point – at least not yet.
“The recent rate decreases have definitely helped, but affordability remains a concern. I do believe if we can maintain some stability in mortgage rates at this level, we will begin to see a greater number of prospective buyers re-enter the market,” Samsing said.
Susan DeMello, a Virginia-based loan officer for PNC Mortgage, said she is still expecting to see an increase in loan production due to lower mortgage rates.
“The markets go up quickly and down slowly,” the LO told HousingWire.
Uptick in demand
Mortgage rates had been trending up with the Fed’s consecutive interest rate hikes, which are a bid to combat persistent inflation. However, the U.S. Bureau of Labor Statistics reported last week that the consumer price index (CPI) rose by 7.7% year over year in October, marking the smallest 12-month increase since the year ending in January 2022. That’s slightly below the 7.9% estimated by the markets.
Consequently, mortgage rates have started on a downward trend. According to HousingWire’sMortgage Rates Center, Black Knight’s Optimal Blue OBMMI pricing engine, which includes some refinancing products, measured the 30-year conforming rate at 6.59% on Wednesday, down from 7.09% the previous week. Meanwhile, the 30-year fixed-rate jumbo (greater than $647,200) decreased from 6.97% to 6.72%.
Mortgage rates were 6.64% for conforming loans on Wednesday, according to Mortgage News Daily.
Amid lower mortgage rates, demand rose for purchase applications across all loan types, according to a survey by the Mortgage Bankers Association (MBA). The survey, conducted weekly since 1990, covers 75% of all U.S. retail residential mortgage applications.
The market composite index, a measure of mortgage loan application volume, increased 2.7% for the week ending November 11, according to the MBA. The increase was driven by the purchase index, which rose 4%, but was offset by the refinance index, which dropped 2% from a week prior.
“Mortgage applications increased for the first time in seven weeks,” said Bob Broeksmit, president and CEO of the MBA. “Signs of slowing inflation pushed mortgage rates below 7% for the first time since mid-October, but with rates still relatively high and affordability correspondingly reduced, the average loan amount is now at its lowest level in nearly two years.”
Capobianco said Cardinal Financial Company saw “an uptick in applications because, since last Thursday, rates are probably almost a point better than last Wednesday.”
At Offerpad Home Loans, experts noticed a slight increase in applications, mostly related to conforming purchase loans, when rates went down. The company also saw some uptick in the Veteran Affairs (V.A.) purchase applications.
“But this was primarily driven by our client outreach efforts. Most consumers were not aware of the interest rate drop until we reached out to them,” Samsing said.
The number of new housing units started in October continued to decline, a reflection of the continued downward spiral in homebuilder sentiment, dropping 4.2% from September to a seasonally adjusted annual rate of 1.425 million, according to a report released Thursday by U.S. Census Bureau and the U.S. Department of Housing and Urban Development.
October’s annual housing start rate was down 8.8% on a year over year basis, according to the report. These declines come after a sharp monthly drop of 8.1% in September.
“October was a challenging month with disappointing inflation data — though more recent readings have been more positive — and soaring interest rates. It is no surprise that home building activity reverted back to a downward trend, though the drop was not as severe as it was expected to be,” Nicole Bachaud, Zillow’s economist, said in a statement.
Decreases in both single family and multifamily homebuilding contributed to the slower pace of building, with the single-family sector posting a 6.1% monthly decline and the multifamily sector falling 0.5% from the month prior.
However, the number of multifamily housing starts is up 17.3% year over year, at an annual pace of 556,000, while the number of single family housing starts is at a pace of 855,000, down 20.8% from a year ago.
Regionally, housing starts were down month over month in the Northeast (-34.7%), Midwest (-11.1%) and West (-10.6%), but they were up 6.7% in the South. On a yearly basis, housing starts were down in the Midwest (-13.6%), South (-1.1%), West (-19.6%), and the Northeast (-15.8%).
“Prices for construction materials and labor remain significantly elevated, though material costs have shown some signs of easing. Prices for steel, plywood, copper, gypsum and concrete all remain significantly higher than pre-pandemic, but recorded month-over-month declines in October,” Odeta Kushi, First American’s deputy chief economist, said in a statement.
“On the labor side, according to the October jobs report, average hourly earnings in construction were up 6.6% on a year-over-year basis, significantly above the pre-pandemic average pace of approximately 2.8 percent,” Kushi said.
In addition to elevated prices, builders are seeing fewer buyers thanks to the rising interest rates and continued affordability issues.
“Affordability is also a concern, as rates remain significantly elevated compared with one year ago,” Kushi said. “The average 30-year, fixed mortgage rate in October was 3.8 percentage points higher than one year ago. Holding income constant, the increase in rates reduced house-buying power by approximately $178,000.”
Reflecting these challenges is the decrease in the number of building permits issued. Overall, building permits were issued as a seasonally adjusted annual rate of 1.526 million, down 2.4% month over month and 10.1% year over year. Both the single family and multifamily sectors recorded monthly drops, decreasing 3.6% and 1.9%, respectively.
Despite these challenges, experts believe there are reasons to be optimistic.
“As builders pull back on starting new projects, they will have greater opportunity to bring to market the large backlog of homes in their pipelines that are already under construction,” Kushi said.
Although the number of housing completions was down 6.4% from September to a seasonally adjusted annual rate of 1.339 million, they were up 6.6% year over year, with both the single family sector (up 2.7%) and multifamily sector (up 18.3%) posting yearly gains.
https://frankbuysphilly.com/wp-content/uploads/2022/06/Mattamy-Homes-2.jpeg8001200Frank Buys Phillyhttps://frankbuysphilly.com/wp-content/uploads/2017/10/Bo-Final-Logo.pngFrank Buys Philly2022-11-17 16:44:462022-11-17 16:44:46Housing starts continued to slide in October amid ongoing challenges
By the time 2022 is wrapped up, mortgage lenders will have originated about $2.2 trillion in loans, about half of 2021’s $4.4 trillion in volume, according to industry forecasters. But Brian Hale, who is assisting several buyers in their hunt for independent mortgage bank acquisition targets, sees an even more brutal landscape ahead. He projects that over the next 12 months, mortgage originations nationwide could come in as low as $1.3 trillion to $1.7 trillion.
That’s an ugly scenario. With such a drastic downturn, the pressure for industry consolidation increases dramatically. As part of the restructuring, there will be winners (the buyers) and there will be losers — those whose names disappear from the corporate registries due to sales, mergers or failure, observers told HousingWire.
Based on numerous interviews with mergers and acquisitions experts, we dove into the 2023 IMB buyer profile.
Who wants to be in the mortgage business?
Brett Ludden, managing director of Sterling Point Advisors, a merger and acquisitions advisory firm based in Virginia, projects that nearly one-third of the 1,000 largest IMBs will disappear by the end of 2023 via mergers, acquisitions or failures.
Most homebuilders … leave that excess [potential business] on the floor, but the smarter homebuilders look at that and go, ‘There’s an opportunity there.’
Brian Hale, CEO of mortgage advisory partners
Hale, founder and CEO of California-based Mortgage Advisory Partners, said that level of consolidation in the IMB industry “would not shock me.” He added, however, that it could turn out to be a lower number because some mortgage bankers may “figure out how to shrink costs” and hang on through the downturn.
Still, consolidation is clearly underway in the mortgage banking industry already. Within the past week, one of the nation’s largest retail mortgage lenders, Charlotte-based Movement Mortgage, announced the acquisition of Mortgage Network, a deal that would add $2 billion in annual loan volume, 250 mortgage professionals and 31 branch offices to its network.
Hale added that another large IMB, California-based Guild Mortgage, also “appears to be in a substantive acquisition mode.” In addition, Hale said he is currently working with three clients who are looking to buy IMBs — two of which are homebuilders and one he described as a “proptech/fintech” company.
Hale, of course, could not reveal the names of those clients, although he did define the type of acquisition targets they are seeking to find as buyers.
“The profile that we created [for our clients] is we want companies with multiple state licenses and all three tickets — Fannie Mae, Freddie Mac and Ginnie Mae — so the buyer ends up with a fully functioning mortgage-banking company that has warehouse and agency relationships,” Hale said.
For the homebuilders he is representing, Hale said acquiring a mortgage-lending operation is a smart way to take advantage of “low-hanging fruit,” among other drivers for such an acquisition.
“For every 100 buyers who walk into a community showroom, [a homebuilder] sells 8% to 15% of those buyers a home in their community,” Hale said. “The rest of those people are still looking for a house.
“If you deliver 5,000 homes a year, that means you had 50,000 people looking for a house walk across your platform who are likely prequalified by your loan officers, and you … have a relationship with them. Most homebuilders … leave that excess [potential business] on the floor, but the smarter homebuilders look at that and go, ‘There’s an opportunity there.’”
Hale added that is “why homebuilders want to be in the mortgage business.”
The plug-and-play and brokerage routes
David Hrobon, a principal with the Colorado-based mortgage advisory firm the Stratmor Group, in a recent report projected that some 50 merger or acquisition deals will be announced or closed by year’s end, which is 50% more transactions than in 2018 — the prior high-water mark for lender consolidations over the past three decades.
The key driver of that is the [loan-production] volume from the seller is worth more to the buyer than it is to the seller, due to the synergies that the buyer brings.
Garth Graham, senior partner at stratmor group
“Lenders that turn all their attention to refinancing when that business skyrockets enjoy huge profits,” said Garth Graham, senior partner and manager of M&A activities for the Stratmor Group. “But the tide always eventually turns, and when it does, many of those lenders struggle to stay afloat.
“We’re seeing a lot of that this year, and it will certainly continue in 2023.”
Graham said most of the acquisition deals will likely involve larger IMBs buying smaller IMBs because those larger players, unlike the smaller players, have the scale to make money off added loan production — without adding significant additional expenses.
“The key driver of that is the [loan-production] volume from the seller is worth more to the buyer than it is to the seller, due to the synergies that the buyer brings,” Graham said.
Thomas Yoon, president and CEO of California-based non-QM lender Excelerate Capital, which is owned by the company’s chairman, Mike Thompson, said for the top 200 IMBs, M&A deals may be a workable option. For the middle-tier lenders not in that group, however, Yoon expects so-called “plug and play” deals to be attractive because they are far more cost-effective.
“So, it’s kind of like, we don’t want your debt. We don’t want all your problems, but we’ll take your core people,” Yoon said. “They’re like, ‘Screw the company. We’ll just buy the talent [i.e., loan officers] in pods.’”
Another path to survival for some IMBs, according to Ludden, might be to convert to a brokerage operation.
These people have a lot of wealth, and if they are choosing to invest in a different direction, they might choose to take the gains and free up the equity to invest in their newest ventures.
Brett Ludden, managing director of Sterling Point Advisors
“We’re seeing correspondent lenders that are considering making the choice to transition back to being purely brokers because that allows them to jettison a substantial amount of costs,” he said. “So, while that company may not fail, it’s changing its business model significantly.”
“We’ve recently had several lenders tell us that they have just no avenue to continue,” Ludden added. “Some inform us that they will be closing the doors, while others are desperately trying to cut costs, even beyond what I think is probably feasible cost cutting.”
Some lenders, he added, are even changing their origination focus to survive.
“A small East Coast lender, for example, has in the last couple of months picked up their California license and is now almost exclusively focused on doing high-dollar reverse mortgage transactionsin California,” Ludden said.
The 2023 buyer profile
Ludden also expects that IMBs owned by wealthy individuals or families “are going to be some of the biggest buyers.” Among the IMBs that fit that description are Freedom Mortgage, Academy Mortgage, Gateway Mortgage, New American Funding, Movement Mortgage, CMB Financial, Vistal Point Mortgage, Excelerate Capital and more.
Ludden stressed, however, that just because they are privately held by wealthy individuals does not mean they are necessarily in a buying (or selling) mode. Each lender is unique, with different challenges, opportunities and balance sheets, he stressed.
IMBs that are independently owned by a single wealthy investor or a family, however, tend to have more flexibility when it comes to return on investment, or “ROI demands,” and they often have “a pool of cash” to draw on to support dealmaking,” Ludden said.
“I don’t think the idea that [some of] these companies might also be looking for exits is inconsistent with the thesis,” Ludden added. “These people have a lot of wealth, and if they are choosing to invest in a different direction, they might choose to take the gains and free up the equity to invest in their newest ventures.”
This business is really complicated in many ways. It’s also simple in one way: It’s very helpful if you actually make more money than you spend.
Brian Hale, ceo of mortgage advisory partners
Hale added that we might even see foreign interests — such as European or Asian banks — that are looking for an entry point into the U.S. real estate market consider acquiring an IMB franchise. Regardless of which combination of IMBs find themselves at the M&A alter over the next year, however, it’s clear the face of the industry is about to change to comport with the new realities facing it.
“Overall, we think there is likely a need for more meaningful capacity reduction, given that volumes in 2023 are expected to be down nearly 60% from the peak in 2020,” a recent report by New York-based investment bank and broker-dealer Keefe, Bruyette & Woods states. “… We also think there is a limit to how much companies can reduce headcount without sacrificing technology or damaging morale.
“We think this creates a challenge that could be supportive of consolidation.”
Hale added that, in the end, there are two predominate ways to acquire a mortgage operation — an asset purchase or a stock purchase.
“With an asset purchase,” he said, “you leave the old entity behind and all the risks associated with it, and it’s really the equivalent of a big hiring transaction, with some cash paid to the original stockholders.” With a stock purchase (the route Hale said his current clients are pursuing), “the buyer acquires every sin that the seller has committed since the beginning of time,” so Hale said conducting thorough (and often expensive) due-diligence research is essential.
“…This business is really complicated in many ways,” Hale added. “It’s also simple in one way: It’s very helpful if you actually make more money than you spend.”


 :215-447-7209
 : deals(at)frankbuysphilly.com
Here’s why new home sales are up along with prices
Today new home sales beat estimates, and new home median sales prices hit an all-time high. What is going on here? My job is always to be the detective, not the troll so let’s take a look at today’s data, as there is a constant theme here that I have talked about for some time. Hopefully, I can make sense of this report, which showed the home sales beat estimates with prices still at all-time highs.
From Census: New Home Sales Sales of new single-family houses in October 2022 were at a seasonally adjusted annual rate of 632,000, according to estimates released jointly today by the U.S. Census Bureau and the Department of Housing and Urban Development. This is 7.5 percent (±20.8 percent)* above the revised September rate of 588,000, but is 5.8 percent (±19.6 percent)* below the October 2021 estimate of 671,000
New home sales haven’t gone anywhere for a few months now, and this report also had negative revisions to the prior reports. The cancellation rates are rising, this is true, but the Census reports don’t properly account for those sales being lost. In theory, the sales levels are lower than the data will show.
Also, these reports are very wild month to month, so we can get a swing back lower in next month’s report. However, with all that said, new home sales are historically low today and have been for some time. We are well below the 2000 recession level and back to 1996 levels.
When you account for a population of over 330 million people, that sales number looks a lot lower than in 2000 and 1996 so be mindful that we are trending at low levels today.
While the actual sales trends can be more downward than the report shows, it’s not off by a significant amount. We are, for now, bouncing off the bottom that we had back in 2018, which was historically low as well.
In 2005, when the housing bubble peaked in sales at around 1.4 million, we had a clear, aggressive downtrend in sales with cancellation rates rising aggressively. Today we are finding a low base for now, because new home sales are historically low.
I would be careful reading too much into this report or even the current trend. The housing market has been in a recession since June of this year, and we have other data lines that can be more useful in gauging the new home sales sector.
From Census: For Sale Inventory and Months’ Supply The seasonally adjusted estimate of new houses for sale at the end of October was 470,000. This represents a supply of 8.9 months at the current sales rate.
My rule of thumb for anticipating builder behavior is based on the three-month supply average. This also has nothing to do with the existing home sales market; this monthly supply data is only for the new home sales market.
The existing home sales market has 3.3 months of supply, so we have had a historical gap between new and existing monthly supply for some time now. However, since I started my housing economic work, this has been my rule of thumb:
The three-month average of monthly supply in the chart above is running at 8.6 months, and the monthly supply headline number did fall for the previous report. This data line has always been key to my work, which has run well with the builder’s confidence data that has gone into waterfall collapse mode, as you can see below. This data line is considered positive when it’s above 50 and currently at 33.
We are still in housing recession land as the builders still have a lot of new construction homes and haven’t started yet to build.
For the builders, 61,000 new homes are completed for sale, amounting to 1.2 months of the supply, and 298,000 new homes are still under construction, while 111,000 haven’t started. The last two data lines account for 7.7 months left in the data.So as you can see, we have a lot of homes that aren’t on the market from the 8.9 months of the supply. We can see why the builders are done building new single-family houses as they have a lot of work left to do ( Article Link).
From Census: Sales Price The median sales price of new houses sold in October 2022 was $493,000. The average sales price was $544,000.
This part of the new home sales data has confused many people per the last few reports because it is true we have hit an all-time high in median sales prices for new homes. Over the past month of social media, I have tried to convey this message about using median sales price data for the new home sales market. This data line can move highly one way or another based on the mix sale shift of prices. This means that getting a report that has an outsized of bigger homes sold can tilt the data aggressively higher.
Earlier in the year, when we saw a more significant percentage dip in median sales prices, this was due to having more smaller-sized homes in the sales mix. Just know that median sales price data always need to be taken with a grain of salt.
Another housing data line reported today was purchase application data, which scored its third straight week of growth, coming in at 3% week over week. That data is still down 41% year over year, but as I’ve said for many months now, the year-over-year comps were going to be very difficult starting from October to January. This means we should expect 35%-45% year-over-year declines to be the norm. Right on schedule, since October we have seen year over year declines range between 39%-46%.
The last time we had three straight weeks of growth in purchase apps was the middle part of June. I caution that we are working from historically low levels, so the bar is low, but after three weeks of growth — and seeing the year-over-year decline become less — this is something worth noting. We will continue to keep an eye on this, especially if mortgage rates head lower.
I understand that the new home sales reports have been confusing at times this year but remember that the trend is your friend. We are working from historically low sales levels, and the builders are pulling out all the stops to sell what homes they can while rates are high.
The new home sales sector improved significantly when mortgage rates dropped to 5%. However, for now, the monthly supply levels are still too high for the builders to start new construction, and we can see they have a lot of work to do with homes still under construction.
With purchase application data showing some life now after mortgage rates have dropped, 2023 is shaping up to be very interesting. For now, I hope you can enjoy the Thanksgiving holiday with your family and eat well!
Source link
Washington, D.C. Real Estate Market—Stats And Trends In 2022
Sponsored
Source link
Why this small lender is running straight into the non-QM fire
Amid surging rates, declining volumes and a reduced appetite from investors in the secondary market, there are a growing number of casualties in the mortgage space, especially in the riskier non-QM segment.
First Guaranty Mortgage Corp. (FGMC), controlled by global investment management firm PIMCO, filed for Chapter 11 bankruptcy protection in June. Michael Strauss’s Sprout Mortgage shut down in July, laying off its staff without paying salaries and severance. Meanwhile, Athas Capital Group is winding down its operations and Impac Mortgage Holdings is backing off the product.
But right when several companies are turning away from non-QM products, a Colorado-based lender has decided to launch a new division to cater to this market. The question is: why?
Stronghill Capital – a small-balance commercial lender owned by the $20 billion-plus asset management firm ArrowMark Partners – announced last week it had launched a new residential lending division to provide borrowers with non-QM products, non-agency jumbos and investor programs.
“Probably it seems very counterintuitive when companies are running away from the flames in the fire, to see a company like ours making an announcement that we are going to go full bore running into the fire,” Dustin Wells, recently appointed as the co-president at Stronghill Capital, told Housingwire.
Stronghill, however, is no stranger to the non-agency and investor loan space.
The company sells loans via brokers for clients – usually LLCs, C-corps or S-corps – to acquire residential real estate for commercial and investment purposes. Now, business owners can also apply for a mortgage loan as an individual.
“So, for example, if I’m a business owner working with a brokerage to buy five investment properties that I’m going to invest in my LLC, but I also want to buy a new primary residence or a second home, now we can be that one-stop-shop for this client,” he explained.
According to Wells, Stronghill originates about $500 million a year to real estate investors, employing about 30 staff members, and has “trusted partnerships with warehouse providers in the space to provide credit facilities to fund loans on an ongoing basis.”
With surging rates, lenders are struggling to sell legacy lower-rate loans originated months ago in the secondary market as investors seek higher yields. This liquidity problem caused the implosion of non-QM lenders, but Wells said that by entering the market now, Stronghill “fortunately don’t have any legacy issues like these companies.”
The company, which operates in wholesale and delegated and non-delegated correspondent channels, will outsource most of the back office work for the new division.
Wells said Stronghill is not competing with wholesale lenders with aggressive pricing, like United Wholesale Mortgage or Homepoint. He said Stronghill’s brokers deal with more “esoteric” cases, while these companies are “built on scalability through simplicity.” Consequently, Deephaven and Angel Oak would be the natural competitors.
Stronghill has licenses in five states for the new division – Arizona, Colorado, Florida, South Carolina and Texas – but is working on getting 44 licenses in total.
Looking forward, Wells said the new division will grow according to, among other things, the Federal Reserve funds rate.
“We’re saying somewhere between $400 million and $500 million is our projection for the residential consumer space heading into next year. And then, depending on where things track in 2023, we could see exponential growth into 2024,” Wells said.
Despite higher rates, Wells said borrowers are looking at purchase loans because there is currently less competition for houses compared to the past two years.
“Now, you might be paying a higher rate, but you’re able to negotiate on those properties and can work through getting a lower rate in the future,” he said. “But right now, the focus is: Can I get the house at the right price, whereas before, was I going to pay too much?”
Source link
How To Build Effective Systems In Your Real Estate Business
If you are like me, I suspect you’ve heard a good number of gurus, or even seasoned, well-meaning investors, give the following advice in some form or fashion:
“Systems and policies are essential. If you want a business that works, you need to have systems and policies. You need to have those systems and policies, and you need to follow those systems and policies because systems and policies are absolutely essential to have and follow. Systems and policies!”
While it is certainly true that systems and policies are extremely important as I will elaborate on further shortly. Of course, just saying that isn’t particularly helpful. The “how” part is often missing, unfortunately. So, in this article, I will at least sketch out an outline of how to approach building systems and policies for real estate investors.
Why Systems and Policies Are So Important
First and foremost, the reason systems and policies are so important is because it’s a massive waste of time and energy to simply reinvent the wheel over and over again. Indeed, even the simple act of making decisions can be exhausting, and so if there is a solution ready to go for a given problem (i.e. a system or a policy), you can execute that solution with little thought and devote your mental energy to something else.
Systems also make it easier to delegate tasks, as employees and contractors won’t have to continually ask for directions. They also allow you to maintain quality control and standardize outcomes throughout the various parts of your business. Furthermore, they make it easier to stay on the right side of the law as treating someone (particularly a prospective or actual tenant) differently than another one could amount to a violation of Fair Housing.
But the most important reason for systems and policies, at least in this author’s humble opinion, is that they lay the groundwork to scale your business. It’s important to remember scaling is not growth. Instead, scaling is what facilitates growth. Investopedia defines it as follows,
“Scalability refers to the ability of an organization (or a system, such as a computer network) to perform well under an increased or expanding workload. A system that scales well will be able to maintain or increase its level of performance even as it is tested by larger and larger operational demands.”
Growth for the sake of growth is the philosophy of cancer, which, left unabated, will eventually kill its host (the business). Only through scaling (which relies on systems and policies) can the foundation be laid to “maintain or increase” the “level of performance even as it is tested by larger and larger operational demands.”
Only through scaling can you truly and sustainably grow a business. And even if you don’t want to grow that much, systems and policies will make your life a whole lot easier, shrink your liability and increase your profits.
The Key Point To Remember
I can’t think of anyone who has actually said this, but I do think there is an underlying assumption that many entrepreneurs believe you build your systems, and then you build your business. Or perhaps, you start off by building your business by going from one whim to the next, and then you realize you need systems, so you add those, and then you go back to building your business.
If I could ensure that this article accomplishes one thing, it would be to permanently remove this idea from your mind.
Business does not work in such a sequential manner. Instead, you should be building your systems and policies in lockstep with your business. It’s an iterative and never-ending process. As you expand your business, you should be expanding and updating your systems and policies. It never ends. Don’t expect it to.
Learning and Borrowing From Others
Of course, that doesn’t mean you need to start from scratch and feel your way through the dark to only learn from hard-fought (and expensive) experience.
There are plenty of good sources to learn from, including here at BiggerPockets. You should be regularly reading articles (on real estate and business in general), reading books, listening to podcasts like the BiggerPockets Real Estate podcast, and attending meetups and conferences. You should definitely be involved at your local Real Estate Investors Association or BiggerPockets meetup groups and ask seasoned investors about their various systems. Trust me, people love to talk about themselves. They’ll open up.
There are also four books, in particular, I would recommend reading when it comes to systems and policies. Any business owner should read through these:
The E-Myth Revisited by Michael Gerber
This book outlines the importance of thinking of your business like a franchise owner would, creating the policies that could be handed to someone else in another market to replicate.
The Checklist Manifesto by Atul Gawande
Gawande highlights the incredible improvement all sorts of organizations have made by simply having and following checklists for recurrent tasks. You should definitely start making these. We have developed checklists for creating scopes of work, screening residents, moveouts and deposit disposition, analyzing properties, due diligence, and financing properties, etc. Having these and following them dramatically reduces mistakes and oversights.
Traction by Gino Wickman
Wickman goes over creating an EOS (Entrepreneurial Operating System) that covers every part of your business and then hones and streamlines them as best as possible.
Scaling Up by Verne Harnish
Harnish might as well take the torch from where Wickman leaves off when it comes to scaling. He particularly highlights the importance of creating key performance indicators (KPIs) to monitor and improve performance throughout your company.
As a bonus, I would also add Getting Things Done by Gary Allen to systematize your own life.
Of course, if you are a new investor, you don’t need to read all of these before you get started. But I would definitely get on reading them as soon as possible.
Laying the Groundwork
As soon as you can, you want to start building systems, even if that’s before you get started. (Although you should not use a lack of systems as an excuse to procrastinate, again, building systems is a never-ending process.)
You should start by identifying your core processes. As Gino Wickman notes in Traction,
“It’s surprising how productive this step is. This exercise creates clarity of thought that is then put down in black and white…just by calling your processes by a consistent name, you reduce complexity and increase efficiency in the organization.”
So, for example, in our business, we have the following core processes. Yours will likely be a bit different, but this should make it clear what you are aiming for.
We have then blocked these into several departments. So, I oversee acquisition and refinancing. My brother oversees human resources and assists in acquisition, and my dad is in charge of finding private lenders (financing). Thus, in our main office, we have four other departments that report to us:
I don’t have the space here to go over each component of each department, so we’ll hyperfocus on one aspect to give a general idea. In this case, we’ll look at how a typical turnover is handled through the property management and rehab departments.
Our process is as follows, with the department in charge noted in parenthesis.
This process requires several checklists and policies embedded within it. For example, we have a scope of work template in Excel for writing up scopes. We have a bid template in Smartsheet we send out to contractors. We have a deposit disposition template as well as a master availability list that shows everyone in the organization where things are at as the property proceeds from the management department to the rehab department and back.
Some of these templates are available free of charge. BiggerPockets itself has a long list of landlord forms, including applications and leases you can get for free. If you are a real estate agent, your brokerage and the MLS should also have such forms.
Find an Agent in Minutes
Match with an investor-friendly real estate agent who can help you find, analyze, and close your next deal.
As you standardize your processes, you should also standardize your materials. Use the same paint colors (or just a few), vinyl, countertops, appliances, etc., for your rehabs and turnovers. This will make it simpler to acquire and replace these items and also make it more likely you can simply make repairs or do a touch-up rather than a full replacement.
Now, this probably sounds like a lot. It is. You may be just starting, and the idea of having departments could sound ludicrous to you. That’s completely understandable. It was how I would have felt not too long ago. Remember, building systems is an iterative process. Build your systems for you in the meantime, and soon enough, you will be hiring others who you will want to make sure to follow those very same systems. Trust me, you will need to be continuously building and changing your systems and policies as you grow.
Indeed, we have a whole smorgasbord of old Google sheets and Word documents in what we refer to as the “Google Docs Graveyard” meandering about the cyberspace. There will be plenty of false starts and curveballs no matter how well laid your plans are.
The Iterative Process of Building Systems and Making Policies
Again, there’s only so much you can do upfront. As you go, you will run into all sorts of problems that you hadn’t thought of nor planned for. These unique problems, however, are great opportunities to systematize your business.
Indeed, with each new decision you make, you should attempt to create a system or policy out of that. Don’t just fly by the seat of your pants as problems get thrown at you. Yes, it takes more time in the beginning to systematize and/or create policies. But this is a Quadrant II activity (important but not urgent), as Stephen Covey discussed in his classic book The Seven Habits of Highly Effective People. These are the tasks that reduce the amount of time you need to spend on such issues going forward.
These Quadrant II tasks “maintain or increase” the “level of performance even as [your company] is tested by larger and larger operational demands.”
These Quadrant II tasks are the ones you need to prioritize.
To give you an idea of how this works, here are a few examples we have had to deal with and the solution we have come up with:
Problem 1: Cockroach infestation at a house three weeks after a tenant moves in.
Policy Solution: If infestation is within the first month of tenancy, it’s on us (they were likely there when the tenants moved in), afterwards, the cost is on the tenant.
Problem 2: Tenant constantly pays late, clogging up management resources.
Policy: Allow for one payment plan per year. Afterward, an eviction notice will be filed, and the tenant will either need to pay the whole balance or set up a time to leave.
Problem 3: A maintenance order takes way too long, and it was our fault.
Policy: In such cases (when it’s not so egregious, we would consider a rent discount), we offer a gift card to their favorite restaurant (which we ask for when they sign the lease) to smooth things over.
Of course, not everything can be systematized or made into a policy. On a recent portfolio purchase, a tenant gave notice to leave to the seller while we were under contract. Their lease, however, went for another six months. The seller had been soft about enforcing lease terms, so the tenant thought it would be fine. And they just got a house under contract to buy and couldn’t afford both the mortgage and the lease. In this case, we asked the seller to prepay two months of their rent, and we would call it good and let the tenant out of their lease. He agreed.
You can’t really create a policy for such a specific situation, but you can for many. And you can create broad outlines of how to respond to really unique circumstances (i.e. if, while under contract, the seller wants to let a tenant out of their lease, we expect to be compensated for it). So, while it’s impossible to cover every scenario, and you certainly need to leave room for flexibility when it comes to many decisions, you can still systematize and make policies for a lot of ground.
And that will go a long way to scale your business and facilitate future growth (and continued sanity).
Key Performance Indicators
As you go, you will want to start developing KPIs for each major area of your business. Broad indicators for your company are pretty simple and should include things like:
But these indicators are very broad and don’t tell you a lot about why things are the way they are. Thereby, you also want to nail down KPIs for managers, or in the high likelihood that you don’t have managers, departments, or areas of your business.
While it’s true that you may not know whether the number you get with any given KPI is good or bad, you know what’s better and what’s worse. So you know which direction things are going and also have something to aim for, which clarifies your (or your manager’s) goals.
Here are some examples that we track for different departments:
Acquisition
Turnover
Property Management
Maintenance
Those are, of course, just what we do. Yours don’t have to be the same. But they do give you a good idea of how things are going. And while monthly anomalies shouldn’t be surprising (particularly with things like “Average Cost of Turnover”), these aberrations should work themselves out over the long run and give you a good idea of how things are going.
And if you do have managers, they are a great way to evaluate their job performance without micromanaging or blindly trusting them.
One last note here, in order to track your KPIs effectively, you need to have quality accounting. In addition, in order to sell at top prices and get banks to lend to you or just know whether you’re solvent, it’s critical to have your accounting in order. This is not something to skimp on. Make accounting a priority and either learn accounting or, better yet, outsource or hire someone capable of doing it.
I can’t tell you how many times I’ve seen small investors selling a property with horrible accounting. Such a state of affairs not only reduces the value of their asset but it makes it all but impossible to scale.
Conclusion
Systems and policies are essential for scaling, and scaling is essential for growth. But again, the biggest takeaway here is not just that systems and policies are good and necessary, it’s that building them is an iterative process that never ends.
Don’t be scared or overwhelmed by the thought of them. Every entrepreneur starts with zero systems in the same way every real estate investor starts with zero properties. But in the same way, you don’t intend to stay at zero properties, you should intend to grow your systems alongside your company. Back forth, around and around, forever and ever.
Find financial freedom through rentals
If you’re considering using rental properties to build wealth, this book is a must-read. With nearly 400 pages of in-depth advice for building wealth through rental properties, The Book on Rental Property Investing imparts the practical and exciting strategies that investors use to build cash flow and wealth.
Note By BiggerPockets: These are opinions written by the author and do not necessarily represent the opinions of BiggerPockets.
Source link
Days on market grow despite low inventory for existing homes
The National Association of Realtors (NAR) reported today on two trends in existing home sales that we have seen for many months now: sales are declining while total inventory data has fallen directly for the three straight months. On a positive note, however, the days on the market are no longer a teenager anymore: that metric grew from 18 days to 21 days.
I cheer because the savagely unhealthy housing market theme I talked about back in February of this year was the same premise of the housing reset talking point the Federal Reserve uses. Total inventory data started at all-time lows at the beginning of 2022, creating more bidding war action in January and February, peaking in March.
We needed to end this madness before we had prices escalate over 20% for another year. The Federal Reserve wanted to see the bidding wars end and the days on the market grow. This is happening, and in the long run, this is a plus for the housing market.
When I outlined my 23% five-year growth model for 2020-2024, it was to have a marker for when price growth got too hot. I didn’t have to worry about this in the previous expansion — as my long-term work stated for a decade, the years 2008-2019, would have the weakest housing recovery ever.
We don’t have any housing bubble or overheated demand data, nor can we. This article, which I wrote in 2019, does show you the historical work in the past decade on the housing bubble talk.
However, I knew the years 2020-2024 would see better demand from the bump in demographics. This could potentially put us in a horrible place with inventory, which it did, and prices accelerated beyond my five-year price-growth model in just two years. I am staying consistent with my work and model when I described the housing market in February as savagely unhealthy.
Soon after, the Fed came in with their housing reset premise. Now we are getting the call back to balance, which is good. The positive aspect of today’s data line is that the days on the market grew again, and we are getting off the teenager level.
NAR Research: First-time buyers were responsible for 28% of sales in October; All-cash sales accounted for 26%; Individual investors purchased 16%; Distressed sales represented 1% of sales; Properties typically remained on the market for 21 days in October.
One thing about housing data we all need to be mindful of is that the year-over-year comps will be very challenging until we get to the end of January. Last year starting in October, purchase application data had an abnormal volume rise toward the end of the year. Even though the data was still showing negative year-over-year prints due to COVID-19 comps, the percentage was getting less and volumes were growing.
It was a funky time with housing data last year; people needed to make COVID-19 comp adjustments. As mortgage rates rose more and more, the October to January data was going to show big negative prints.
NAR Research: Total existing-home sales decreased 5.9% from September to a seasonally adjusted annual rate of 4.43 million in October. Year-over-year, sales dropped by 28.4% (down from 6.19 million in October 2021).
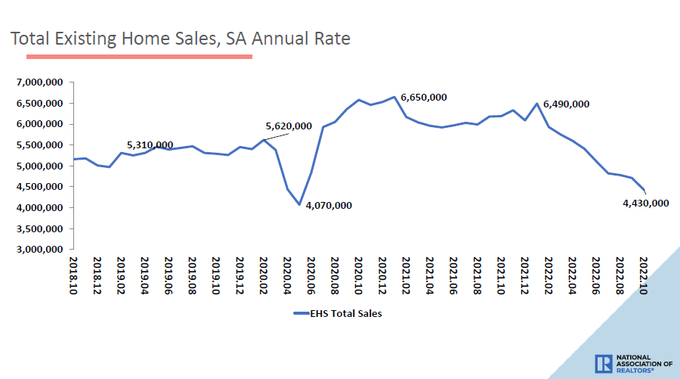
I anticipated purchase application data to have 35% to 45% year-over-year declines starting in October. That has occurred right on schedule; the last print came down 46%. If housing data takes another leg lower, we would see negative prints of 53%-57%. The last two weeks have had positive weekly data of +1% and +4%.
Total housing inventory fell in this report, the third report in a row that shows total inventory has decreased. Seasonal impacts are the norm with housing, and new listing data is negative 6% year to date.
We saw new listing data decline when rates got to 6.25% the first time. This is not a positive for the housing market. A traditional seller is primarily a homebuyer, so not only do we lose the inventory for sale when this happens, but we also lose a buyer. This is another factor in driving purchase application data below 2008 levels. However, as we can see, the inventory data looks much different than what we saw in 2000, 2005, 2008, 2012, 2015 and 2018.
NAR lists the current inventory at 1.22 million, while historical normals are between 2 million to 2.5 million, with a peak in 2007 a tad over 4 million. The monthly supply grew from 3.2 months to 3.3 months.
Price growth has been cooling off more noticeably, similar to other periods when mortgage rates rose. However, the extreme level of price growth we had earlier this year was savagely unhealthy, so this news isn’t just welcome — it’s needed to bring balance back.
NAR Research: The median existing-home price for all housing types in October was $379,100, a gain of 6.6% from October 2021 ($355,700), as prices rose in all regions.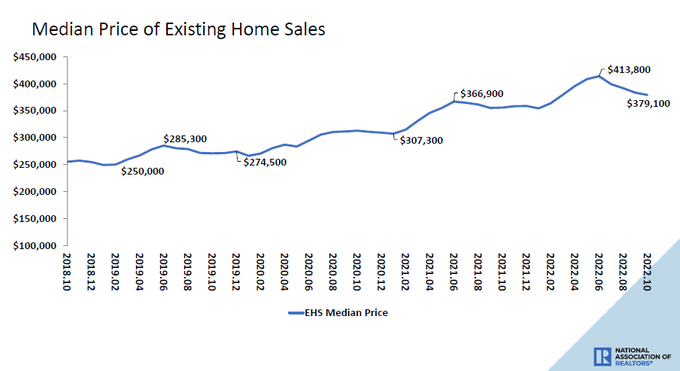
With today’s report, we see the continued trend of demand destruction from higher rates and a lack of new listing growth. The severely unhealthy housing market is returning to a B&B marketplace, boring and balanced, but still needs more time.
The parts of the country at 2019 inventory levels are already off my savagely unhealthy list; the rest are still struggling to get more new active listings. The Federal Reserve can help the housing market by saying one sentence about the pivot; however, it’s not there yet, and housing market inflation is their big concern.
Going out for next year, though, the rent inflation data is lagging on the CPI data and is already showing a cooldown. We see the inflation growth rate falling in other data lines as well.
If mortgage rates can get down toward 5%, we can see some stabilizing in the housing data that is working from a much lower bar now. This is the way to get out of the housing recession that started in June.
Source link
Builders apply the brakes amid canceled contracts
The best way to fight inflation is to add more supply, and when I look at the housing completion data for the past two years, it just makes me want to puke. In previous expansions, builders’ housing completion data would move in line with housing starts and permits. However, for the first time in recent modern-day history — due to supply chain issues and other factors — housing completion data has lagged behind housing permits and starts.
It simply has taken too long to build homes to full completion over the last several years. At different times we’ve seen homes that were mostly finished but had no garage doors, or were waiting on windows or appliances. For this reason, the number of housing units “under construction” is the largest ever recorded in history because they were taking so long to finish.
For the builders, they have a new problem: they had homes under contract and then mortgage rates jumped in the biggest fashion ever recorded in history. So, cancelation rates are rising when the homes are finished and ready to move in. Given that, you can see why they are in no rush to finish or even start to build on homes in the pipeline.
At first, the backlog was simply a supply issue. Now, with mortgage rates so high, I believe there is less financial incentive for builders to start on the homes they haven’t begun to build yet. I personally wouldn’t do it. If the builders could, they would take some of the past contracts back, but they’re just stuck with these homes. Not everyone cancels their contracts, of course, but people are mindful of other people getting better deals.
Housing construction productivity has always been terrible compared to other sectors of our economy; I get that, as we still build homes with hammers and nails, not robots.
To give some numbers on the topic, the gap between housing completions data today versus the housing bubble peak is roughly 700,000 — almost half of the total completion data today. As you can see in the chart below, we had a nice, slow up-trend from 2002 to 2005 and here in the 2020 to 2022 timeframe, we haven’t gone anywhere much with total completion data. We need to push these homes onto the market to get inflation lower.
From Census: Housing Completions Privately owned housing completions in October were at a seasonally adjusted annual rate of 1,339,000. This is 6.4 percent (±10.6 percent)* below the revised September estimate of 1,431,000 but is 6.6 percent (±12.6 percent)* above the October 2021 rate of 1,256,000. Single-family housing completions in October were at a rate of 961,000; this is 8.3 percent (±8.2 percent) below the revised September rate of 1,048,000. The October rate for units in buildings with five units or more was 362,000.
As you can see from the data above, we have some work to do, and we have 928,000 2-unit housing under construction, the most since 1973. So, the best way to break shelter inflation down is to get more supply onto the market as soon as possible. This is why it’s frustrating to see the housing completion data look like it does. However, it’s also something that should be expected.
Housing starts
Housing Starts Privately owned housing starts in October were at a seasonally adjusted annual rate of 1,425,000. This is 4.2 percent (±12.7 percent)* below the revised September estimate of 1,488,000 and 8.8 percent (±12.7 percent)* below the October 2021 rate of 1,563,000. Single-family housing starts in October were at a rate of 855,000; this is 6.1 percent (±13.4 percent)* below the revised September figure of 911,000. The October rate for units in buildings with five units or more was 556,000.
Housing starts data has room to head lower as the new home sales sector still has way too much supply (from the builders’ perspective) to even consider building more single-family housing. The builders’ business model is to not ever oversupply a marketplace, so they’re right to halt all new construction until the supply of single-family homes goes lower through more new home sales.
My rule of thumb for anticipating builder behavior is based on the three-month average of supply. This also has nothing to do with the existing home sales market, this monthly supply data is only for the new homes sales market.
We currently have 9.2 months of supply, and we will get an update on this data line next week, as the new home sales report will show that the builders are still struggling to sell more homes with higher rates. Mortgage rates getting back to 5% would solve some of their issues, but above 7% is problematic.
Rates have come down from their recent highs and we did see a pick-up in the weekly purchase application data with back-to-back positive weeks. However, we still have a lot of work here to bring supply lower.
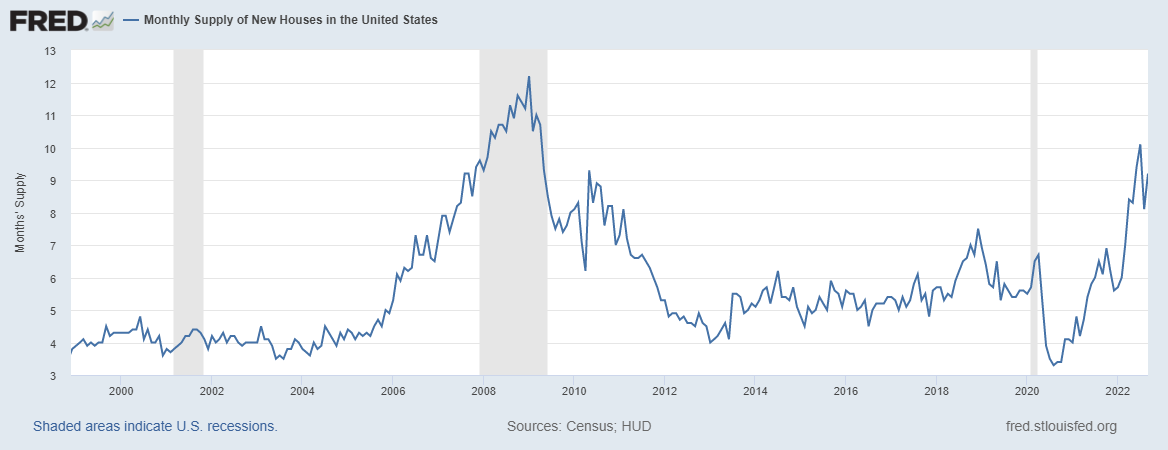
We can easily see this in the builders’ confidence data, which has collapsed almost back to the lows of COVID-19. In March of this year, I wrote how the business model for the builders was at risk as the 10-year yield broke over my critical level of 1.94%. In June, I declared the housing market in a recession and since then, the builders’ confidence data has had a waterfall collapse back toward the 33 levels.
From the NAHB:
Housing permits Building Permits Privately-owned housing units authorized by building permits in October were at a seasonally adjusted annual rate of 1,526,000. This is 2.4 percent below the revised September rate of 1,564,000 and is 10.1 percent below the October 2021 rate of 1,698,000. Single-family authorizations in October were at a rate of 839,000; this is 3.6 percent below the revised September figure of 870,000. Authorizations of units in buildings with five units or more were at a rate of 633,000 in October.
Housing permits for multifamily construction haven’t collapsed as badly as single-family housing, but I believe over time, this will occur as rent inflation fades. The real-time data on rents shows the cooling process is already significantly elevated. This is something to keep track of for next year because losing both single-family and multifamily construction at the same time will drive housing permits much lower than where we are now.
With all that said, we can see the struggles that the builders are having, however, we can also clearly see that the builders are in a much better spot to deal with this housing recession than at the peak of 2005.
Back in 2005, new home sales were so elevated from exotic loan debt structures that the collapse in sales was truly epic. It was a massive 82% decline in sales from the peak of 2005 to the housing crash lows. Now, the builders aren’t dealing with such an elevated level of sales, so they can work on getting rid of their excess supply with much less market stress.
Also, a huge difference for the builders now is that they’re dealing with less competition. Back in 2007, we had over 4 million housing units for sale with crushing demand. The builders were in a terrible position as their product wasn’t where the dollars were going. New homes are always more expensive than older cheaper existing inventory so the builders are mindful of the competition.
Now over time, as active listings grow, they will take notice as they did in the previous expansion. However, if we are talking about the housing bubble crash versus now, they’re in a much better situation to deal with this housing recession.
Existing home sales are coming up tomorrow and in the last report, the total inventory level was 1.25 million.
With that said, we all need to hope that the builders can get the wave of multifamily construction onto the market for next year to drive rent inflation lower and lower. That will be a plus for mortgage rates, which can get us out of the housing recession. As you can see from today’s report, we aren’t there yet, but we have the supply coming!
Source link
Finding growth opportunities in the non-QM space in 2023
Between the shift towards self-employment and the number of Millennials entering the housing market, the market for non-QM is poised for substantial growth in the year to come. HousingWire recently spoke with John Keratsis, president and CEO of Deephaven Mortgage, about what lenders should be doing to capitalize on the boom in non-QM lending and why our preconceived notions about non-QM could be all wrong.
HousingWire: Why is now such an important time to prioritize non-QM?
John Keratsis: The timing to get into non-QM couldn’t be better for a couple of reasons. First, the non-QM market is poised for long-term, sustainable growth. This is a direct result of a monumental shift in the US to the self-employed workstyle. Contract or ‘gig’ workers, entrepreneurs and business owners need non-QM mortgages because they may be unable to produce the W-2 tax form used to verify qualifying income for a traditional loan.
Driving this workstyle change is the largest population cohort in US history: Millennials. As millions of self-employed Millennials settle down and start to raise families, they are looking for their first home. Millennials were born between 1982 and 2000. So, the Millennial homebuying demand is set to continue for a span of eighteen years!
Right behind the Millennials are the Gen Zers – the third largest population in US history. Gen Zers are also big on the self-employed workstyle. All of which means there will be a sustained demand for non-QM loans for many years to come.
Another reason to get into non-QM lending at this very moment is diversification. Just about every lender is looking for alternative revenue sources to offset the decline in refinances and the very tight purchase market. Offering non-QM loans provides access to those millions of borrowers who want mortgages but are unable to qualify for a traditional loan.
The timing is right from the capital markets perspective, too. Residential mortgage credit provides diversification benefits to institutional investors. Historically, RMBS have performed comparatively well during downturns in the stock market.
HW: How has the growing trend of self-employment led to the need for more robust non-QM products?
JK: Per above, it’s a perfect storm. Millennials, at 72.19 million are the largest population cohort in US history, are now settling down, starting families and looking for their first homes.
Millennials also make up a vast segment of the largest non-QM borrower cohort: the self-employed. Ironically, the pandemic put homeownership in closer reach for self-employed workers. By making it acceptable to work from anywhere, they are free to move around the country and purchase homes in more affordable geographies where it takes less time to save for the all-important down payment.
HW: Non-QM loans are surrounded by misconceptions. How can lenders debunk myths about non-QM lending?
JK: The biggest misconception is that non-QM is only for borrowers who can’t qualify for a traditional loan due to poor credit. We’ve found that the best way to debunk this is to simply use the facts. In today’s non-QM loan pools, FICO scores can range between 730-740, DTIs generally meet Agency standards and LTVs are in the low 70s.
Beyond that, it’s important to point out that non-QM, like the traditional market, shifts and evolves with the industry. The rise of self-employed borrowers is one trend. Another is the demand for single-family rental properties. Even industry professionals are surprised to learn that business purpose DSCR (Debt Service Coverage Ratio) loans make up about 30% of our business. America’s aging housing stock is fueling this trend as property investors purchase single-family homes from downsizing baby boomers, fix them up and then use them to generate rental income. This is also another indication of how the non-QM sector continues to evolve to serve shifting industry trends. We have the flexibility to quickly align products and services with market demands, whereas the traditional mortgage market does not. Today, Deephaven can close a DSCR loan in as few as 15 days.
HW: What is Deephaven Mortgage doing to expand non-QM lending?
JK: We know the demand for non-QM loans will only keep growing. We know that investors, attracted by higher yields, want them on the capital markets side.
To a certain degree, we have to just keep doing what we’re already doing: 1) keep educating lenders, brokers, real estate agents and borrowers about non-QM mortgages; 2) continue to build out both wholesale and correspondent distribution channels; and 3) implement ongoing enhancements to our non-QM customer experience.
At Deephaven, we are continuously running webinars to bring new loan officers into the non-QM fold. We’re investing heavily in technology to create truly seamless service delivery. As demands grows, competition for non-QM loans will, too. The tiebreaker will become the borrower and client experience.
To learn about the opportunities in non-QM lending, visit deephavenmortgage.com.
Source link
Mortgage rates collapsed 47 basis points. Is this a turning point?
Some lenders have experienced a spike in borrowers’ demand for mortgage loans following last week’s rate collapse due to softer inflation data. However, according to executives and loan officers, it’s too early to say that this marks a turning point in the shrinking mortgage market.
To illustrate how fast mortgage rates have declined, the 30-year fixed rate decreased this week to an average of 6.61%, down from last week’s 7.08%, according to the latest purchase mortgage survey from Freddie Mac. The same rates averaged 3.10% one year ago.
“Mortgage rates tumbled this week due to incoming data that suggests inflation may have peaked,” Sam Khater, Freddie Mac’s chief economist, said in a statement.
However, according to Khater, “while the decline in mortgage rates is welcome news, there is still a long road ahead for the housing market: inflation remains elevated, the Federal Reserve is likely to keep interest rates high and consumers will continue to feel the impact.”
Other executives echoed Khater’s sentiments.
“We’re seeing some relief,” Frank Capobianco, senior vice president at Cardinal Financial Company, said. “But many people are hesitant to say that this is the turning point until they see the December’s CPI numbers and the decision from the December’s Fed meeting.”
“J.R.” Samsing, vice president at Offerpad Home Loans, agreed, stating that “unfortunately,” the market has not reached a turning point – at least not yet.
“The recent rate decreases have definitely helped, but affordability remains a concern. I do believe if we can maintain some stability in mortgage rates at this level, we will begin to see a greater number of prospective buyers re-enter the market,” Samsing said.
Susan DeMello, a Virginia-based loan officer for PNC Mortgage, said she is still expecting to see an increase in loan production due to lower mortgage rates.
“The markets go up quickly and down slowly,” the LO told HousingWire.
Uptick in demand
Mortgage rates had been trending up with the Fed’s consecutive interest rate hikes, which are a bid to combat persistent inflation. However, the U.S. Bureau of Labor Statistics reported last week that the consumer price index (CPI) rose by 7.7% year over year in October, marking the smallest 12-month increase since the year ending in January 2022. That’s slightly below the 7.9% estimated by the markets.
Consequently, mortgage rates have started on a downward trend. According to HousingWire’s Mortgage Rates Center, Black Knight’s Optimal Blue OBMMI pricing engine, which includes some refinancing products, measured the 30-year conforming rate at 6.59% on Wednesday, down from 7.09% the previous week. Meanwhile, the 30-year fixed-rate jumbo (greater than $647,200) decreased from 6.97% to 6.72%.
Mortgage rates were 6.64% for conforming loans on Wednesday, according to Mortgage News Daily.
Amid lower mortgage rates, demand rose for purchase applications across all loan types, according to a survey by the Mortgage Bankers Association (MBA). The survey, conducted weekly since 1990, covers 75% of all U.S. retail residential mortgage applications.
The market composite index, a measure of mortgage loan application volume, increased 2.7% for the week ending November 11, according to the MBA. The increase was driven by the purchase index, which rose 4%, but was offset by the refinance index, which dropped 2% from a week prior.
“Mortgage applications increased for the first time in seven weeks,” said Bob Broeksmit, president and CEO of the MBA. “Signs of slowing inflation pushed mortgage rates below 7% for the first time since mid-October, but with rates still relatively high and affordability correspondingly reduced, the average loan amount is now at its lowest level in nearly two years.”
Capobianco said Cardinal Financial Company saw “an uptick in applications because, since last Thursday, rates are probably almost a point better than last Wednesday.”
At Offerpad Home Loans, experts noticed a slight increase in applications, mostly related to conforming purchase loans, when rates went down. The company also saw some uptick in the Veteran Affairs (V.A.) purchase applications.
“But this was primarily driven by our client outreach efforts. Most consumers were not aware of the interest rate drop until we reached out to them,” Samsing said.
Source link
Housing starts continued to slide in October amid ongoing challenges
The number of new housing units started in October continued to decline, a reflection of the continued downward spiral in homebuilder sentiment, dropping 4.2% from September to a seasonally adjusted annual rate of 1.425 million, according to a report released Thursday by U.S. Census Bureau and the U.S. Department of Housing and Urban Development.
October’s annual housing start rate was down 8.8% on a year over year basis, according to the report. These declines come after a sharp monthly drop of 8.1% in September.
“October was a challenging month with disappointing inflation data — though more recent readings have been more positive — and soaring interest rates. It is no surprise that home building activity reverted back to a downward trend, though the drop was not as severe as it was expected to be,” Nicole Bachaud, Zillow’s economist, said in a statement.
Decreases in both single family and multifamily homebuilding contributed to the slower pace of building, with the single-family sector posting a 6.1% monthly decline and the multifamily sector falling 0.5% from the month prior.
However, the number of multifamily housing starts is up 17.3% year over year, at an annual pace of 556,000, while the number of single family housing starts is at a pace of 855,000, down 20.8% from a year ago.
Regionally, housing starts were down month over month in the Northeast (-34.7%), Midwest (-11.1%) and West (-10.6%), but they were up 6.7% in the South. On a yearly basis, housing starts were down in the Midwest (-13.6%), South (-1.1%), West (-19.6%), and the Northeast (-15.8%).
“Prices for construction materials and labor remain significantly elevated, though material costs have shown some signs of easing. Prices for steel, plywood, copper, gypsum and concrete all remain significantly higher than pre-pandemic, but recorded month-over-month declines in October,” Odeta Kushi, First American’s deputy chief economist, said in a statement.
“On the labor side, according to the October jobs report, average hourly earnings in construction were up 6.6% on a year-over-year basis, significantly above the pre-pandemic average pace of approximately 2.8 percent,” Kushi said.
In addition to elevated prices, builders are seeing fewer buyers thanks to the rising interest rates and continued affordability issues.
“Affordability is also a concern, as rates remain significantly elevated compared with one year ago,” Kushi said. “The average 30-year, fixed mortgage rate in October was 3.8 percentage points higher than one year ago. Holding income constant, the increase in rates reduced house-buying power by approximately $178,000.”
Reflecting these challenges is the decrease in the number of building permits issued. Overall, building permits were issued as a seasonally adjusted annual rate of 1.526 million, down 2.4% month over month and 10.1% year over year. Both the single family and multifamily sectors recorded monthly drops, decreasing 3.6% and 1.9%, respectively.
Despite these challenges, experts believe there are reasons to be optimistic.
“As builders pull back on starting new projects, they will have greater opportunity to bring to market the large backlog of homes in their pipelines that are already under construction,” Kushi said.
Although the number of housing completions was down 6.4% from September to a seasonally adjusted annual rate of 1.339 million, they were up 6.6% year over year, with both the single family sector (up 2.7%) and multifamily sector (up 18.3%) posting yearly gains.
Source link
Meet the likely buyers of independent mortgage banks in 2023
By the time 2022 is wrapped up, mortgage lenders will have originated about $2.2 trillion in loans, about half of 2021’s $4.4 trillion in volume, according to industry forecasters. But Brian Hale, who is assisting several buyers in their hunt for independent mortgage bank acquisition targets, sees an even more brutal landscape ahead. He projects that over the next 12 months, mortgage originations nationwide could come in as low as $1.3 trillion to $1.7 trillion.
That’s an ugly scenario. With such a drastic downturn, the pressure for industry consolidation increases dramatically. As part of the restructuring, there will be winners (the buyers) and there will be losers — those whose names disappear from the corporate registries due to sales, mergers or failure, observers told HousingWire.
Based on numerous interviews with mergers and acquisitions experts, we dove into the 2023 IMB buyer profile.
Who wants to be in the mortgage business?
Brett Ludden, managing director of Sterling Point Advisors, a merger and acquisitions advisory firm based in Virginia, projects that nearly one-third of the 1,000 largest IMBs will disappear by the end of 2023 via mergers, acquisitions or failures.
Hale, founder and CEO of California-based Mortgage Advisory Partners, said that level of consolidation in the IMB industry “would not shock me.” He added, however, that it could turn out to be a lower number because some mortgage bankers may “figure out how to shrink costs” and hang on through the downturn.
Still, consolidation is clearly underway in the mortgage banking industry already. Within the past week, one of the nation’s largest retail mortgage lenders, Charlotte-based Movement Mortgage, announced the acquisition of Mortgage Network, a deal that would add $2 billion in annual loan volume, 250 mortgage professionals and 31 branch offices to its network.
Hale added that another large IMB, California-based Guild Mortgage, also “appears to be in a substantive acquisition mode.” In addition, Hale said he is currently working with three clients who are looking to buy IMBs — two of which are homebuilders and one he described as a “proptech/fintech” company.
Hale, of course, could not reveal the names of those clients, although he did define the type of acquisition targets they are seeking to find as buyers.
“The profile that we created [for our clients] is we want companies with multiple state licenses and all three tickets — Fannie Mae, Freddie Mac and Ginnie Mae — so the buyer ends up with a fully functioning mortgage-banking company that has warehouse and agency relationships,” Hale said.
For the homebuilders he is representing, Hale said acquiring a mortgage-lending operation is a smart way to take advantage of “low-hanging fruit,” among other drivers for such an acquisition.
“For every 100 buyers who walk into a community showroom, [a homebuilder] sells 8% to 15% of those buyers a home in their community,” Hale said. “The rest of those people are still looking for a house.
“If you deliver 5,000 homes a year, that means you had 50,000 people looking for a house walk across your platform who are likely prequalified by your loan officers, and you … have a relationship with them. Most homebuilders … leave that excess [potential business] on the floor, but the smarter homebuilders look at that and go, ‘There’s an opportunity there.’”
Hale added that is “why homebuilders want to be in the mortgage business.”
The plug-and-play and brokerage routes
David Hrobon, a principal with the Colorado-based mortgage advisory firm the Stratmor Group, in a recent report projected that some 50 merger or acquisition deals will be announced or closed by year’s end, which is 50% more transactions than in 2018 — the prior high-water mark for lender consolidations over the past three decades.
“Lenders that turn all their attention to refinancing when that business skyrockets enjoy huge profits,” said Garth Graham, senior partner and manager of M&A activities for the Stratmor Group. “But the tide always eventually turns, and when it does, many of those lenders struggle to stay afloat.
“We’re seeing a lot of that this year, and it will certainly continue in 2023.”
Graham said most of the acquisition deals will likely involve larger IMBs buying smaller IMBs because those larger players, unlike the smaller players, have the scale to make money off added loan production — without adding significant additional expenses.
“The key driver of that is the [loan-production] volume from the seller is worth more to the buyer than it is to the seller, due to the synergies that the buyer brings,” Graham said.
Thomas Yoon, president and CEO of California-based non-QM lender Excelerate Capital, which is owned by the company’s chairman, Mike Thompson, said for the top 200 IMBs, M&A deals may be a workable option. For the middle-tier lenders not in that group, however, Yoon expects so-called “plug and play” deals to be attractive because they are far more cost-effective.
“So, it’s kind of like, we don’t want your debt. We don’t want all your problems, but we’ll take your core people,” Yoon said. “They’re like, ‘Screw the company. We’ll just buy the talent [i.e., loan officers] in pods.’”
Another path to survival for some IMBs, according to Ludden, might be to convert to a brokerage operation.
“We’re seeing correspondent lenders that are considering making the choice to transition back to being purely brokers because that allows them to jettison a substantial amount of costs,” he said. “So, while that company may not fail, it’s changing its business model significantly.”
“We’ve recently had several lenders tell us that they have just no avenue to continue,” Ludden added. “Some inform us that they will be closing the doors, while others are desperately trying to cut costs, even beyond what I think is probably feasible cost cutting.”
Some lenders, he added, are even changing their origination focus to survive.
“A small East Coast lender, for example, has in the last couple of months picked up their California license and is now almost exclusively focused on doing high-dollar reverse mortgage transactions in California,” Ludden said.
The 2023 buyer profile
Ludden also expects that IMBs owned by wealthy individuals or families “are going to be some of the biggest buyers.” Among the IMBs that fit that description are Freedom Mortgage, Academy Mortgage, Gateway Mortgage, New American Funding, Movement Mortgage, CMB Financial, Vistal Point Mortgage, Excelerate Capital and more.
Ludden stressed, however, that just because they are privately held by wealthy individuals does not mean they are necessarily in a buying (or selling) mode. Each lender is unique, with different challenges, opportunities and balance sheets, he stressed.
IMBs that are independently owned by a single wealthy investor or a family, however, tend to have more flexibility when it comes to return on investment, or “ROI demands,” and they often have “a pool of cash” to draw on to support dealmaking,” Ludden said.
“I don’t think the idea that [some of] these companies might also be looking for exits is inconsistent with the thesis,” Ludden added. “These people have a lot of wealth, and if they are choosing to invest in a different direction, they might choose to take the gains and free up the equity to invest in their newest ventures.”
Hale added that we might even see foreign interests — such as European or Asian banks — that are looking for an entry point into the U.S. real estate market consider acquiring an IMB franchise. Regardless of which combination of IMBs find themselves at the M&A alter over the next year, however, it’s clear the face of the industry is about to change to comport with the new realities facing it.
“Overall, we think there is likely a need for more meaningful capacity reduction, given that volumes in 2023 are expected to be down nearly 60% from the peak in 2020,” a recent report by New York-based investment bank and broker-dealer Keefe, Bruyette & Woods states. “… We also think there is a limit to how much companies can reduce headcount without sacrificing technology or damaging morale.
“We think this creates a challenge that could be supportive of consolidation.”
Hale added that, in the end, there are two predominate ways to acquire a mortgage operation — an asset purchase or a stock purchase.
“With an asset purchase,” he said, “you leave the old entity behind and all the risks associated with it, and it’s really the equivalent of a big hiring transaction, with some cash paid to the original stockholders.” With a stock purchase (the route Hale said his current clients are pursuing), “the buyer acquires every sin that the seller has committed since the beginning of time,” so Hale said conducting thorough (and often expensive) due-diligence research is essential.
“…This business is really complicated in many ways,” Hale added. “It’s also simple in one way: It’s very helpful if you actually make more money than you spend.”
Source link