One slice of the single-family home market that has gained traction over the past year in a topsy-turvy housing landscape is the build-for-rent sector — or BFR.
Construction starts in the BFR market are being propelled by the ongoing demand for single-family rental units as high mortgage rates and limited for-sale inventory push home-purchase prospects further out of reach of many would-be homebuyers.
Still, even the single-family rental (SFR) market, including the BFR sector, faces an uncertain future in the year ahead, given the ongoing volatility in interest rates and inflation. Both pose threats to access to capital, the cost of materials and labor, and future housing values.
Through much of 2022, however, build-for-rent housing remained a hot ticket, with supply continuing to increase, “even with the economy showing signs of volatility and capital costs increasing,” according to a November special report from Minneapolis-based Northmarq.
“Developers are forecast to start 74,000 [BFR] units in 2022, up from 59,000 units in 2021,” states the report by Northmarq, a capital markets leader with some $33 billion in annual transaction volume and a loan-servicing portfolio of more than $76 billion. “… The number of units delivered this year is on pace to rise 21 percent, to 64,000 units [compared with 53,000 units in 2021].
“With many homebuilders feeling the impact of rising mortgage rates on new-home sales, delivering units for rent is expected to continue to become a larger segment of the overall single-family housing market.”
The Northmarq report points out that the BFR sector currently accounts for only a small slice of overall home starts, at about 6%. A recent report by MetLife Investment Management estimates that there are about 14 million SFR homes nationally, including the BFR sector.
“The softer for-sale housing market, particularly for new homes, is expected to allow single-family rental operators to acquire blocks of new homes, finished lots and larger land parcels from homebuilders,” Northmarq’s market report adds.
The National Association of Home Builders (NAHB) also recognizes the potential of the build-for-rent (BFR) sector. It’s “Eye on Housing” report published in mid-November indicates that there were 68,000 BFR construction starts over the four quarters ending in Q3 of 2022, up 42% compared with 48,000 such starts during the prior four-quarter period.
“While the market share of [single-family] BFR homes is small, it has clearly been trending higher,” the NAHB report continues. “As more households seek lower-density neighborhoods and single-family residences, a growing number will do so from the perspective of renting.
“This will be particularly true as mortgage interest rates remain elevated and increase. Thus, the [single-family] BFR market will expand in the quarters ahead.”
Riding a cresting wave
Single family rental market leaders that unveiled BFR initiatives in 2022 include Tricon Residential and Progress Residential. The two SFR companies, among the largest operators in the space, announced this past summer that they have thousands of build-for-rent homes planned for development or already in the construction pipeline — some 12,000 on a combined basis. In addition, JP Morgan Chase & Co. and partner New Haven Capital in November announced a $1 billion joint venture to buy and develop SFR properties.
On another front, even multifamily-focused players are getting into the BFR market. TruAmerica Multifamily this past summer launched its own BFR division to develop townhome and SFR communities.
Single-family homebuilders, too, are looking to capitalize on the build-for-rent market, with Lennar Corp., one of the nation’s largest homebuilders, recently offering to sell some 5,000 homes to investors in the SFR market, according to a Bloomberg report. Lennar in 2021, with partners Allianz Real Estate and Centerbridge Partners, launched a subsidiary to acquire and operate SFR and multifamily properties, according to the Bloomberg report.
The surge in build-for-rent single-family housing is coming at a time when there has been a sharp decline in overall in single-family home construction. NAHB attributes that decline to “stubbornly high construction costs (due to inflation), elevated interest rates and flagging demand,” which combined are “harming housing affordability.” Housing starts as of November 2022 were “down 32% since February, when mortgage rates began to rise,” NAHB reports.
Although growing single-family BFR demand is an overall plus for the homebuilding industry, there are economic forces working to dampen enthusiasm for the SFR market as well. Those headwinds also are being fueled by the double-edged sword of high interest rates and stubborn inflation and include declining home values; the prospects of a recession later this year (and with it, rising unemployment); a pattern of moderating rents; and continuing liquidity and fundraising challenges posed by capital-markets volatility.
The Mortgage Bankers Association projects unemployment could reach 5.5% by the end of this year, up from 3.7% as of November 2022. Home prices are already declining and are projected to drop further over the coming year by anywhere from a modest 1.5% on an annualized basis, according to Fannie Mae, to as much as 20%, according to some market forecasts.
“For housing markets, the combined forces of rising interest rates and slower economic growth are weighing on demand and pricing,” Northmarq reports. “New and existing-home sales prices have begun to inch lower, and rental rates in most markets have leveled off.”
Knowing where to build
Ben Hunsaker is a portfolio manager focused on securitized credit for Santa Monica, California-based Beach Point Capital Management, an alternative-credit investment firm with about $16 billion in assets under management as of Sept. 30, 2022. He said in addition to SFR operators starting to see rental growth rates slow, or even decline in some areas, as leases turn over, they also have “seen property taxes and cost structures increase materially.”
“So, the operating metrics that it takes to earn an acceptable return on capital have increased, and so [their] top-line revenue growth needs to be increased, but the actual top-line revenue growth is probably stagnating,” he said. “There’s an argument to be made that there’s a sort of evaluation reset that has to happen for these operating entities in the SFR space, which you see generally reflected to some extent in the public stock prices.”
National real estate brokerage platform Redfin reports that investor home purchases dropped more than 30% year over year in the third-quarter of 2022, which is “the largest decline since the Great Recession, aside from the second quarter of 2020,” at the height of the pandemic. Redfin defines investors as any institution or business that acquires residential real estate. Its report is based on an analysis of county records across 40 of the largest U.S. metro areas.
“Investor purchases slumped 26.1% on a quarter-over-quarter basis, the largest quarterly decline on record with the exception of the start of the pandemic,” the Redfin report notes. “That compares with a 17.4% quarterly drop in overall home purchases.”
NAHB also reported that the BFR home-start mark for the third quarter of 2022 (some 16,000 new homes) is down 6% compared with third-quarter 2021.
Signs of sputtering in the BFR market surfaced as early as August of last year, when SFR company Home Partners of America, controlled by private-equity firm Blackstone Group, announced it was pausing home purchases in a total of 38 markets as of Oct. 1, 2022, according to a CoStar News report. Bloomberg reported in October that another major player in the SFR market, Invitation Homes, was in search of a partner for a $1 billion joint venture. The report added that seeking external capital was preferable to raising money through an equity offering, given at that point the company’s stock price “was down roughly 28%” since the start of the year — and it has continued to drop further since then.
“Headwinds have been gathering with rising financing costs, uncharted inflation, elevated geopolitical risks, and increasing concerns about a general economic recession,” states a September 2022 report on the SFR securitization market by Kroll Bond Rating Agency. “Should these factors lead to meaningful declines in home prices, rental rates and/or operating margins, the [SFR] sector will be subject to stress it has not previously encountered.”
That stress is already present in the homebuilding market, according to Stuart Miller, executive chairman of Lennar Corp., who was among the executives presenting at the homebuilder’s recent third-quarter earnings call.
“Our current view is that production of single-family and multifamily dwellings nationally will be down between a quarter to a third in 2023, exacerbating the national housing-supply shortage,” Miller said during the Dec. 15, 2022, earnings call. “Numerically, that means that approximately 1.5 million homes produced over the past couple of years per year will drop to around a million homes produced.”
“… While our [home-sale contract] cancellation rate of 26% is decidedly higher than the 12% last year, it has been falling from the peak of 28% reached in October, and we expect it to normalize below 20% in the near future,” he added.
Hunsaker pointed out that if you’re a builder in the current market, your options include “shelving the land that you’ve banked or that you’ve optioned to build up, or building it up … and selling it to one of these build-for-rent aggregators as an SFR.”
“… So, I think there’s joint incentive structures there that make [BFR] a hard art asset class to wrap your hands around.”
With that said, Hunsaker said the BFR market is becoming much more a game of geographic chess, adding that “there are great places for build-for-rent and there are awful places for build-for-rent.” He points to Florida, a long-time hot SFR market (along with the southern Sunbelt states generally), as an area where there are now many not-so-good places to pursue BFR communities.
“You’re not land-constrained” in terms of building opportunities in many Florida communities, he said, and there already has been a lot of SFR development and activity — plus, he added, “you have this really hard-to-measure impact for insurance … post-hurricane.”
The Northmarq report indicates that year to date through October of 2022, BFR construction starts in the South generally have accounted for “63 percent of the national total, up from 61 percent in 2021.”
“It [BFR] has become very regional, community by community, city by city,” Hunsaker added. He said it takes a high level of sophistication to capitalize on the market now, pointing to JP Morgan Chase, a relatively new BFR sector entrant via its recent joint venture with New Haven, as an example of a player that likely has the market intelligence to make good bets.
In the build-for-rent zone
Doug Faron, one of three founding partners at Florida-based Shoreham Capital, a BFR and multifamily residential developer focused on markets in the Southeast, agrees with Hunsaker’s take on the direction of the market. But he and his partners — all longtime industry veterans — also believe plenty of opportunities still exist in even crowded SFR markets like Florida.
Among the projects the company is developing is a 175-unit build-for-rent community called The Preserve at Poinciana, which is south of Orlando and slated to start construction in the second quarter of 2023. Shoreham also is developing a more traditional 412-unit multifamily community, called Siesta Lakes, in Cape Coral, Florida, which is set to start construction in the first quarter of this year.
Faron launched Shoreham early last year along with fellow Shorehaven founding partners Nick Zoumas and Steven Figari. Zoumas also is the founder and president of JNS Homes, a West Palm Beach, Florida-based homebuilder with some $1.25 billion in completed construction projects.
“We are partnered with institutional and family office or pension-backed capital to develop these [BFR] assets and hold them in certain instances,” Faron explained in discussing Shorehaven’s BFR strategy. “And we are also selling to what is likely the institutional market on the backend, given the scale these communities [is of a] a size that of fits within that market.”
Faron and Figari, in a recent interview with HousingWire, stressed that Shoreham is focused on developing build-for-rent communities that are more like multifamily projects — and developing them in the right areas. Faron explained that Shoreham’s single-family build-for-rent projects offer many of the same perks that are a staple in large, more upscale apartment complexes — including onsite management and amenities such as gyms and swimming pools.
“Those are the of amenities that people have become accustomed to, especially millennials [now young adults] who are used to living in apartments,” he said.
Figari added that “over time, people will start to see and look at this strategy of what we’re building as being very similar to multifamily, but at the same time you get the benefits of that single-family home.”
Faron said Shoreham is looking at investments across the Southeast, including in Florida, because they are “bullish about the growth there.”
“We certainly have to take into account rising insurance costs [in Florida],” he added, but Faron said there are plenty of unique geographic pockets in a state like Florida, and the Southeast at large, with strong population growth and related strong rent-growth prospects. As an indicator of the growth in West Palm Beach, where Shorehaven is headquartered, Faron said traditional office space has doubled over the past three years.
“People need housing, they need a place to live, and we’re trying to hit an approachable price point with a better product,” Faron said. “… The millennial population is moving toward household formation, and that is requiring them to want yards and garages, and so we think the trend is [toward] larger living units.
“We are really focused on making sure that we’re building the right product [in the right place] for people that can afford to be in there,” he added.
The Northmarq report points out that while the economic picture for build-for-rent projects dimmed as 2022 progressed, “the short- and medium-term outlooks for single-family build-to-rent properties have remained attractive.”
“Renter demand for these homes is being fueled by demographic trends as millennials age and their housing needs change,” the Northmarq report concludes. “… Residents are expected to continue to demand new, single-family rentals, particularly as the affordability of for-sale housing grows further out of reach.”
Source link

 :215-447-7209
 : deals(at)frankbuysphilly.com
Mortgage rates have peaked along with inflation
Today’s inflation data has shown that the peak growth rate of inflation is behind us. This should also mean mortgage rates hit their highs. The key phrase I have stressed since I wrote about the case for mortgage rates to go lower on Oct. 27 is thinking 12 months out. The trend is your friend, and the month-to-month data has cooled off noticeably.
That cooling happened even with the biggest inflation component — shelter inflation — still rising in the lagged modeled CPI data. This means shelter inflation isn’t being properly accounted for versus the real-time data.
The Consumer Price Index month-to-month readings show that inflation has peaked, as seen below.
If it weren’t for the lagging CPI shelter index, the biggest component, the headline core print, would be lower today on a year-over-year basis. It’s a positive thing that most people have gotten the memo on this reality about shelter inflation because it shows how the headline year-over-year prints are lower as we speak.
While still hot, the year-over-year inflation growth rate is falling, see below.

All this is happening with the labor market still very tight, which means the Fed doesn’t need to create a job-loss recession to bring inflation down. The best way to fight inflation is to add more supply, demand destruction is not the most effective way, and it will impact future production.
The jobless claims data on Thursday, as you can see below, was still solid and running at 205,000 for the headline, with a four-week moving average of 212,500.
For those who were saying we needed an unemployment rate above 6% to bring down inflation, you must feel sick to your stomach as that advice would have meant millions of Americans would have lost their job for no reason.
How did the bond market react to this inflation data? It was a mild day compared to what we saw back in November of 2022. However, as I am writing this, the 10-year yield is at 3.45%, which is the third time we are trying to lower this area.
This does mean mortgage rates should be getting better today. We are getting closer to a five-handle in mortgage rates and farther away from the 8%-10% mortgage rates people were talking about late last year when rates peaked at 7.37%.
Digging into the inflation data
From BLS:
The Consumer Price Index for All Urban Consumers (CPI-U) declined 0.1 percent in December on a seasonally adjusted basis, after increasing 0.1 percent in November, the U.S. Bureau of Labor Statistics reported today. Over the last 12 months, the all items index increased 6.5 percent before seasonal adjustment. The index for gasoline was by far the largest contributor to the monthly all items decrease, more than offsetting increases in shelter indexes. The food index increased 0.3 percent over the month with the food at home index rising 0.2 percent. The energy index decreased 4.5 percent over the month as the gasoline index declined; other major energy component indexes increased over the month.
Breaking down some of the internals is key to understanding the CPI data. Of course, the biggest component of inflation is housing. I stressed in late 2020 that shelter inflation was going to take off, but the opposite is the reality now. However, the CPI data lags badly here.
Thankfully, the Federal Reserve understood this and created its own index in December to account for the lag. Back in September, on CPI inflation day, I talked about how this would be a positive story in 2023. I said by January or February, it would be evident that the growth rate of shelter inflation was falling, and people have gotten the memo. I could not have asked for a better outcome than where we are today.
Shelter inflation will always lag; let’s wait until October of 2023 to see when this data line will finally show some peaking and follow the more current data. When that starts to happen, core CPI will fall more noticeably. As we can see in the graph below, the growth rate is still hot here with shelter data.
The growth rate of food inflation looks like it’s peaking; we all know the drama the bird flu has done to egg prices, and there is nothing the Fed can do about that. Food inflation is part of headline inflation, which tends to have wild swings up and down, and this is why it’s not something the Fed looks at.
We all know the massive car inflation story post COVID-19, a lack of production and chips have boosted inflation here badly. However, this is rolling over too.
The energy fall is well known as oil prices have fallen noticeably since the spike from the Russian invasion of Ukraine. Oil is a weapon of war in this modern age and we have fought back on this front with our reserves. But what happens when the reserves run low, and China returns from its COVID-19 shutdowns and starts driving cars again? Something to think about in the future.
The CPI report came in line with what most people were expecting, so there is no real shocker news here. However, the bigger story is the trend, and if you’re hoping for the Fed to keep over-hiking and put the U.S. in a massive recession, today wasn’t a good day for you.
I saw one discussion on Twitter where an analyst was claiming the Fed needs to take the Fed’s fund rate to 7% or 8%. This was the hope for bearish Americans — that maybe the Fed still hadn’t got the memo that the fear of 1970s inflation just isn’t going to stick in this modern-day economy without supply shocks at this stage.
The bond market, as always, had gotten ahead of the Federal Reserve, and maybe the Fed will eventually get it. However, for now, rates are going lower, and the fear of 8%-10% mortgage rates for the spring of 2023 is slowly dying a good death, like the fear of 1970s inflation.
If you want a soft landing, this is the inflation data you want to see, something I talked about last year, even on recession watch. It’s a good day for the United States of America and the housing market.
Source link
Rent Prices Are Falling Every Month—What Happens Now?
Outside of the roller coaster ride the FTX and Terra coins took, I have rarely seen anything quite like the trajectory nationwide rents have taken over the previous year.
Take a look for yourself.
Of course, this is only showing the year-over-year change and not the rents themselves. Rents are still up year-over-year despite the dramatic about-face that occurred around last March. That being said, we have reached an inflection point where rents have started to decline month-over-month in nominal terms as well.
As Realtor.com notes,
“In November 2022, the U.S. rental market experienced single-digit growth for the fourth month in a row after ten months of slowing from January’s peak 17.4% growth. The median rent growth across the top 50 metros slowed to 3.4% year-over-year for 0-2 bedroom properties, the lowest growth rate in 19 months. The median asking rent was $1,712, down by $22 from last month and $69 from the peak but is still $308 (21.9%) higher than the same time in 2019 (pre-pandemic).” [Emphasis mine]
And if we were to account for inflation, the decline is even sharper.
Furthermore, the “builders strike”, as I call it, “could also put off home shopping plans and further increase rental demand.” The supply side also bodes poorly (or bodes well, depending on your perspective) for future rent prices,
“On the supply side, the number of for-rent properties may gradually increase as homebuilding activity continues to pivot to multi-family properties. This extra supply in multi-family homes could shift market balance, raising the still-low rental vacancy rate and helping temper recent rent growth driven by the excess demand.”
To drive home just how dramatic this shift has been, compare the fastest metro-level rent growth in the top ten cities over the past six months, 12 months, and since the beginning of the pandemic, according to data from ApartmentList. It goes from 37% growth since March of 2020 (Tampa) to 7% in the last 12 months (Indianapolis) to 1% in the last six months (Indianapolis).
When the fastest-growing metro area is at 1% growth, that should tell you everything you need to know.
For what it’s worth, the worst-performing market over the past six months was Providence, Rhode Island, at -6%. Since March 2020, the worst has been San Francisco at -5%, but that is mostly due to local factors. In fact, San Francisco is one of only two markets with negative rent growth since March 2020 and one of only five with less than 10% positive rent growth.
Why is This Happening?
One part of this is just seasonality. Prices and rents both tend to dip a bit in the winter. But this is a much larger dip than normal seasonality would predict. There’s much more to the story than just that.
Before the Fed started jacking up interest rates, real estate prices were skyrocketing due to a variety of factors, most notably historically low interest rates and the large, country-wide housing shortage that came from a decade of insufficient housing construction. That shortfall in supply was then further exacerbated by Covid and lockdown-induced delays.
The housing shortage had the same effect on the rental market as it did on the sales market. However, when rates went up, the “sellers strike” began, and new listings fell dramatically. Remember, unlike in 2008, most homeowners today have 30-year fixed loans with low interest rates. There is little incentive to sell.
So one of the first pieces of advice I gave given this new and very odd market was, “[I]f you own your home and need to move for work or other reasons, selling your home is not the way to go.” You really shouldn’t ever sell or refinance a house with an interest rate of 3% or less.
“Instead, it makes more sense to rent out your current home and then rent where you are moving (assuming it doesn’t make sense or is unaffordable to buy there).”
It turns out that a lot of people took this advice or had a similar thought. At the same time that new listings are way down, we have noticed the number of rental listings shoot up in every submarket of the Kansas City metro area we have properties in, both for houses and apartments. It appears to be that way all around the country.
Furthermore, while rents on new listings were increasing by over 15% from one year to the next, that was nowhere near the rent increase the average tenant had to pay. As NPR pointed out, “Government consumer price data show that the average rent Americans actually pay—not just the change in price for new listings—rose 4.8% over the past year.”
The average increase on a lease renewal hasn’t come close to the average increase on a new rental listing. Thus, not surprisingly, many tenants (like homeowners) aren’t moving.
Americans, on the whole, are moving less than at any time since 1948, and according to data from RealPage, apartment lease renewals are at 65%, up almost 10% from just 2019.
With more properties coming to the rental market, that increases competition and puts downward pressure on prices. At the same time, most tenants aren’t paying rent at market rates for new listings six months ago because their lease renewals weren’t keeping up with market increases. Thereby, they don’t have much incentive to move if they are going to have to pay a substantially higher price in order to do so.
Several other trends have also contributed to this state of affairs. For one, many of the construction projects Covid delayed have finally come online, adding additional supply to the market. In addition, inflation and rising housing costs were nearing the limits of affordability in the middle of 2022. This has hampered rent growth, particularly by convincing more Americans to move in together.
As many as one-in-three adults rely on their parents for financial support, and many young adults, in particular, have taken to moving back in with their parents. More Americans are also open to renting out a room or portion of their house. A Realtor.com survey found that a full 51% of homeowners were willing to rent out extra space in their homes, a rate that is highest amongst Millennials (67%). Indeed, Americans living with roommates is an increasingly prevalent trend for years.
All of these trends put together are bringing rental prices back down to Earth.
Is Renting Your Property Now a Bad Idea?
As with the real estate market in general, it is highly unlikely that the rental market will collapse. After all, there is still a housing shortage, and new construction is slowing down again because of high rates (at least high by recent standards).
Furthermore, many people who were looking to buy a home are in the process of giving up and looking to rent. As their plans change, that will increase demand and put upward pressure on the market. And again, part of this recent decline is just seasonality, and as we enter the warmer months, the market should heat up again (pun possibly intended, I’m not quite sure), at least to a certain extent.
Rents skyrocketing over the past few years was an aberration, and the fact they are coming back down to Earth may not be great for landlords, but it is better for the country on the whole. While new purchases are made more difficult by higher interest rates, the rental market should stabilize.
You should not expect rents to be much higher next year than they are now. But I wouldn’t worry too much about being unable to rent your properties.
On The Market is presented by Fundrise
Fundrise is revolutionizing how you invest in real estate.
With direct-access to high-quality real estate investments, Fundrise allows you to build, manage, and grow a portfolio at the touch of a button. Combining innovation with expertise, Fundrise maximizes your long-term return potential and has quickly become America’s largest direct-to-investor real estate investing platform.
Learn more about Fundrise
Note By BiggerPockets: These are opinions written by the author and do not necessarily represent the opinions of BiggerPockets.
Source link
UWM takes another big step to reduce prices
Michigan-based United Wholesale Mortgage (UWM) is taking another step to aggressively reduce its prices in order to gain market share in a shrinking mortgage market.
The company announced on Wednesday that it is giving up to 125 basis points to brokers to use on any loans they lock with the lender, with a maximum of 40 basis points per loan.
According to a spokesperson for the company, LOs can apply their own pricing enhancement to their borrowers with these basis points.
“Sometimes 10-20 basis points is all an LO needs to win over a real estate agent or get creative on a borrower’s loan,” the company said in a statement.
Brokers can use the points for conventional, government and non-agency loans up to $1 million.
The program, dubbed “Control Your Price,” is effective immediately and is evidence of how the company intends to keep pushing its rivals in 2023. To support its strategy, the mortgage lender had about $800 million in cash as of the third quarter of 2022.
For most of 2022, UWM had an aggressive pricing strategy in place to gain market share and attract loan officers from the retail to the wholesale channel. With the Game On initiative, the lender slashed prices across all loans by 50 to 100 basis points.
In December, UWM’s chief strategy officer, Alex Elezaj, told HousingWire the company doesn’t “have any intention right now to stop Game On, which has been a big win for our company.”
According to Elezaj, “Retail loan officers continue to convert over to wholesale, and this [Game On] was an extra incentive.”
Late last year, UWM also expanded temporary buydowns for jumbo loans, which makes sense as borrowers have increased negotiating power amid surging mortgage rates. The company also recently announced a flat fee of $37.35 for credit reports.
Source link
Mortgage demand picks up as seller concessions rise
Loan officers saw an increase in mortgage demand during the first week of 2023 as mortgage rates ticked down. And to close deals, sellers are increasingly coming to the table with concessions and rate buydowns.
“I’ve had five people contact me in the last week or so to talk about buying a new home, which is much better than a month or two ago,” Rochelle Gano, a Vancouver, Washington-based loan officer at Movement Mortgage, told HousingWire.
“It seems like, with every small drop in interest rate, the homebuyer’s interest picks up a little bit. It looks like the decline in rates was about five basis points from what I see on my rate sheet.”
Gano’s experiences reflect what happened in the market overall.
According to the Mortgage Bankers Association (MBA), mortgage applications rose 1.2% for the week ending January 6, compared to the week earlier, when the 30-year rates for conforming loans ($647,200 or less) went from 6.58% to 6.42%.
Purchase applications declined 1% week over week and 44% year over year. Meanwhile, refinancing increased 5% from the previous week and was 86% lower than the same week one year ago. Despite the increase, refis are about 30% of the total applications, well below the past decade’s average of 58%, the data shows.
“Mortgage rates declined last week as markets reacted to data showing a weakening economy and slowing wage growth,” Joel Kan, MBA’s vice president and deputy chief economist, said in a statement.
The Bureau of Labor Statistics reported on Friday that job and wage growth is slowing, although the labor market finished 2022 stronger than expected.
After the labor market data became public, mortgage rates fell aggressively to 6.20%, putting them at more than 1% below the highs of 2022, according to Logan Mohtashami, the lead analyst at HousingWire.
“The bond market saw that wage growth was cooling down, leaving the Federal Reserve with few reasons to keep the rate hike story going much longer,” Mohtashami wrote.
Concessions, mortgage rate buydowns save deals
According to industry watchers, sellers are attracting buyers to their homes through mortgage rate buydowns.
According to a new Redfin report, a record 41.9% of home sellers gave concessions to homebuyers in the fourth quarter of 2022 through money for repairs and mortgage-rate buydowns.
The percentage represents the highest increase since July 2020, when Redfin started tracking this data. In the third quarter of 2022 and the fourth quarter of 2021, sellers gave concessions in 30% of home sales.
“In our current environment, the temporary buydown is attractive because we feel that interest rates will trend lower over the coming year and the buyers will want to refinance in 12 – 24 months,” Gano said.
With a mortgage rate buydown, the seller’s concessions are put in an escrow account, used monthly to make up the difference in interest due between the bought-down interest rate and the permanent fixed interest rate.
Unused funds at the time the borrower refinances go against their loan balance as a principal reduction. “So, in essence, the seller helped pay for their refinance in 12 -24 months. It’s a good strategy for buyers right now,” Gano said.
Lenders are promoting more buydowns as the need for purchase business becomes increasingly critical.
In September 2022, Rocket Mortgage and its wholesale arm, Rocket Pro TPO, started offering a one-year buydown, dubbed the “Inflation Buster.” United Wholesale Mortgage also expanded temporary buydown options for jumbo loans in December to attract more business.
Source link
2023 is the year of action for the housing industry
Well, here we are at the beginning of another year. For those of us in housing finance, the calendar year change really does mean something. There is a mix of hope and uncertainty as we anticipate the potential increase of post-holiday volume and the proven run up to the spring and summer buying season.
However, all of the concerns from last year threaten to carry over — from the fear of recession to stubborn high home prices and the stickiness of sub 3% mortgage rates that keep future buyers firmly planted in their existing homes.
And yet the MBA Mortgage Finance Forecast for 2023 has some bright spots in it. If we can get past Q1 then things start looking up for the rest of the year, with rates expected to get down to 5.2%. There are also all those millennials reaching prime home buying age, and they have to live somewhere, right?
I’ve never been one for New Year’s resolutions or coming up with themes for each year, but much to my surprise when I sat down to write, a theme emerged from the holiday fog: 2023 is a “Year of Action.”
Of course, to seize the opportunity presented by any time period, action is necessary. But in 2023, action seems particularly needed because none of the greatest opportunities to move the ball forward in housing will come easy.
There is no federally funded wind at our back to drive consumer demand and no more cheap capital available to fund every good idea. Action will be required to do more with less and to convert the hard work of previous years into tangible benefits for consumers.
Let’s explore three areas that exemplify the need for action-oriented behavior.
Property Appraisal
I would be remiss not to choose appraisal as the first area that desperately needs action. The past couple years have seen an enormous amount of effort put into shining a spotlight on industry issues such as racial bias, the inability to scale with volume and inconsistent results.
Regardless of whether there is agreement on how to quantify evidence of the problem, there is certainly agreement that there is widespread concern. And yet, 2023 could prove to be one of the greatest turning points for appraisal in decades.
GSE modern appraisal programs are finally expected to transition from test-and-learns to policy, the FHFA appears ready to accelerate work streams and data after their fintech RFI, and the ASC will begin conducting public hearings on appraisal governance and bias starting January 24.
The most groundbreaking aspect of GSE appraisal modernization that gets overlooked is that there is now a tech-driven data standard for how a home should be documented in support of an appraisal. No more clipboards with notes that stakeholders will never see.
The requirement of a mobile app to collect data the same way in every home in every community adds a level of objectivity and consistency that so many consumer advocates have been demanding. The policy change is almost here, but it will require action from lenders, fintechs, appraisal management companies and appraisers to adopt the change.
And while there are substantial cost and time savings to be had, the true benefit is being able to give the consumer a consistent, transparent set of data about their house. A year from now, I would love to talk about the progress that has been made to make potential bias extremely difficult to perpetrate, as opposed to being stuck in debate on its existence.
Housing Affordability
The idea of a holistic approach to housing continues to resonate with me. From basic shelter to sustainable renting that leads to better opportunities for homeownership, it has never been more clear that it takes action to make room for innovation that achieves results.
The more I hang around proptech founders focused on affordability solutions and groups like Ivory Innovations, the more I realize that a holistic approach to housing is also about not staying in a silo.
Property data and valuation solutions are my primary areas of expertise, but housing affordability and increasing the number of people that are “well housed” (thanks to Jeremy Potter for that Dr. Raphael Bostic quote) is an all-hands-on-deck-sized challenge.
Proptech investment has pulled back due to market challenges, but the problems in housing don’t seem to pay much attention to that. They remain. So I am constantly seeking new ways to understand how my expertise can be a help or hindrance to potential solutions.
2023 will be a difficult year to fund every solution-oriented idea, but action can also be funded by an investment of time and collaboration with intent.
Stay the course on non-negotiables
In times like these, where cost-cutting is crucial and almost every company in housing finance is trying to do more with less, you find out quickly where priorities lie. It takes deliberate action to continue to make progress on areas that are perhaps more mission-based but harder to represent on a P&L.
I’ve been asking myself what my non-negotiables are this year. Despite the instability in real estate and mortgage, I really wouldn’t want to be in any other industry.
Borrowers still deserve to be treated equitably regardless of what community they live in or what race they are. The real estate transaction doesn’t have to be 45 days and filled with friction on top of a stressful purchase.
Homeowners should have direct access to accurate home value and equity data so they can make wise financial decisions. Automated valuation and underwriting models can and should create efficiency without increasing bias.
I plan on seizing opportunities to make progress even in the current market. Prioritizing my time, partnering with like-minded people across the industry and using my voice creates opportunity for change.
After furiously watching the World Cup in November and December, the saying “it’s the hope that kills you” is still rattling around in my brain. Fortunately, we don’t have to rely on hope to make an impact in housing.
So many transformative building blocks have already been put in place through years of effort by countless people. Visibility on issues of fairness, policy change for modernization and technology for innovation are all at our fingertips. We just have to take action to see the transformation through.
Source link
Wells Fargo closes correspondent biz, will shrink servicing portfolio
Wells Fargo, the largest depository mortgage lender in America, announced Tuesday that it will officially exit the correspondent channel and also reduce its servicing portfolio, the country’s largest.
The move isn’t much of a surprise. Executives have hinted at it over the past year and Bloomberg reported in August that Wells Fargo would likely shrink or eliminate the correspondent channel. Bank executives reportedly expressed concerns about “reputational risk” when financing large amounts of loans originated from other firms.
Kleber Santos, CEO of consumer lending since his appointment in July, said the bank will continue to be the primary mortgage lender to Wells Fargo bank customers and minority homebuyers through its mortgage retail team.
“We are making the decision to continue to reduce risk in the mortgage business by reducing its size and narrowing its focus,” Santos said in a statement. “As the largest bank lender to Black and Hispanic families for the last decade, we remain deeply committed to advancing racial equity in homeownership.”
In practice, the bank’s portfolio on correspondent lending was already in free fall. From January to September, Wells Fargo originated $37 billion in the space, down 27% compared to the same period in 2021, according to Inside Mortgage Finance data. That was good for no. 3 on the correspondent leaderboard.
A primary source of mortgage servicing rights (MSRs), the correspondent channel has limitations in terms of margins because lenders must pay the network of originators that they aggregate loans from. But it does have the advantage of relying on the strength of small lenders like community banks and independent mortgage banks, which typically have good relationships with local real estate agents and are often purchase-focused.
Analysts at Keefe, Bruyette & Woods (KBW) published a report stating that Wells Fargo’s exit of the correspondent lending market could benefit other big correspondent mortgage originators, such as Pennymac Financial, Amerihome and New Rez/Caliber.
“We estimate that around 10% of [Wells Fargo’s] service volume is Ginnie Mae/FHA [Federal Housing Administration],” the KBW report states. “The reduced role of Wells Fargo in servicing should make it easier for others to grow GSE servicing.
“However, there are far fewer participants in Ginnie Mae servicing, so the reduced role of Wells in that market might result in weaker pricing, which in turn could mean higher borrower rates for FHA borrowers.”
The bank’s mortgage servicing rights book reached $9.8 billion in the third quarter of 2022, up 47% from the third quarter of 2021. Net servicing income rose 5% quarter-over-quarter to $81 million, but was down 26% year-over-year.
It’s unclear how much MSR volume Wells Fargo plans to sell.
Wells Fargo to expand SPCP
In conjunction with announcing the exit from correspondent, the bank also said it’s expanding the current $150 million investment from the Special Purpose Credit Program to include purchase loans (only refinancings were included), investing an additional $100 million to advance racial equity in homeownership, and deploying additional home mortgage consultants in local minority communities.
Wells Fargo’s future in mortgages has been the subject of widespread industry speculation for years. It was the #1 mortgage lender in America about five years ago, but like other depositories has been ceding ground to specialist nonbanks like Rocket Mortgage and United Wholesale Mortgage. Business has notably dipped since Charlie Scharf came on board in the fall of 2019 and vowed to revamp its home loans business.
After reaping strong profits during the height of the pandemic, Wells has fallen on hard times over the last year due to surging mortgage rates and home prices. Wells Fargo originated $21.5 billion in mortgage loans in the third quarter of 2022, a 37% decline quarter-over-quarter. Refinancings fell to 16% of the mix.
The bank imposed several layoffs on its mortgage employees, cutting hundreds of jobs in December.
Wells Fargo was also on the regulators’ radar. In December, the bank agreed to pay a civil penalty of $1.7 billion to settle multiple consent orders related to automobile lending, consumer deposit accounts and mortgage lending with the Consumer Financial Protection Bureau (CFPB).
The bank will report its fourth quarter earnings on Friday.
Source link
Home seller concessions reach pre-pandemic levels
A new Redfin report found a record 41.9% of home sellers gave concessions to homebuyers in Q4 of 2022, through money for repairs and mortgage-rate buydowns. This represents the highest increase of any three-month period since July 2020 when Redfin started tracking this data. In Q3 of 2022 and Q4 of 2021, sellers gave concessions in 30% of home sales.
The report also found that homeowners are selling homes for below the asking price. In Q4 of 2022, 22% of Redfin’s home sales included a concession and lower listing price, while 19% included both a concession and a listing-price cut while the home was on the market.
With the rise in mortgage rates and inflation, concessions regained popularity, reducing the overall cost for homebuyers through money toward repairs, closing costs and mortgage-rate buydowns.
When the 30-year mortgage rate was around 3%, there was a higher demand for homes and such deals were not as popular. During the pandemic, record-low mortgage rates invited more demand and led buyers to outbid the asking price and waive concessions to “have their offers taken seriously,” according to the Redfin report.
Today, mortgage companies are promoting more buydowns. In September 2022, Rocket Mortgage and its wholesale arm Rocket Pro TPO, started offering a one-year buydown, dubbed the “Inflation Buster.” It aimed to reduce a homebuyers’ monthly mortgage payments by a percentage point for the first year of their loan.
United Wholesale Mortgage also expanded temporary buydown options for jumbo loans in December to attract more business. The options include reducing mortgage rates by 2% during the first year of the loan and by 1% in the second year, or by 1% during the first year.
“Buyers are asking sellers for things that were unheard of during the past few years,” said Van Welborn, a Phoenix-based Redfin real estate agent, in a prepared statement. “They’re feeling empowered, partly because their offer is often the only one, and partly because they know sellers have built up so much equity during the pandemic that they can afford to dole out sizable concessions.”
Recently, one of Welborn’s buyers negotiated a $10,000 credit for a new roof and other repairs along with a lower asking price for the home. He has seen this amount go up to $25,000, and a 2-1 mortgage-rate buydown with warranties on household appliances.
Welborn also says we are heading back to pre-pandemic levels of giving concessions. “Sellers realize they’re not going to get $80,000 over the asking price like their neighbor did last year,” he added.
Pandemic boomtowns see a rise in concessions
Concessions are the most popular in the San Diego housing market, with sellers giving concessions to buyers in 73% of home sales. Phoenix (62.9%), Portland (61.6%), Las Vegas (61.3%) and Denver (58.4%) followed.
The increase in concessions over the same period last year was most acute in Phoenix, which was up 33%. Seattle, Las Vegas, San Diego and Detroit all saw the number of concessions rise more than 20% over last year.
Phoenix and Las Vegas in particular were popular destinations during the COVID-19 pandemic and are among the “fastest cooling markets,” per the report. These areas saw a surge in migration as remote workers looked to relocate to affordable and warm areas.
The lowest concession rate of 13.4% was recorded in New York, followed by San Jose (14.4%), Boston (17.5%), Philadelphia (22%) and Austin (33.3%).
Some metros saw a decline in concessions. The rate in Austin decreased from 38.1% in 2021, followed by Philadelphia, New York and Chicago, which were all down 2% or less.
Source link
Daren Blomquist’s 2023 housing outlook
This article is part of our 2022 – 2023 Housing Market Forecast series. After the series wraps, join us on February 6 for the HW+ Virtual 2023 Forecast Event. Bringing together some of the top economists and researchers in housing, the event will provide an in-depth look at the predictions for this year, along with a roundtable discussion on how these insights apply to your business. The event is exclusively for HW+ members, and you can go here to register.
Buyer behavior on the Auction.com platform provides one of the best barometers of the retail housing market because the success and livelihood of these buyers depend heavily on them accurately anticipating what the retail market will look like in the next six to 12 months.
These buyers are primarily local community developers who purchase distressed properties and then resell or rent those properties on the retail market following rehab — a process that typically takes six to 12 months.
Here’s what that buyer behavior in the second half of 2022 is telling us about two key retail market trends in 2023:
1. Home price correction likely nationwide and in majority of markets
Foreclosure auction buyers on the Auction.com platform purchased at an average discount of 29% below estimated “as-is” market value in the fourth quarter of 2022, up from 23% in the third quarter and up from a pandemic low of 9% in the first quarter of 2021. The 29% average purchase discount was also well above the pre-pandemic average of 22% between 2015 and 2019.
The rapidly rising average purchase discount indicates that local community developers are anticipating a rapid slowdown in home price appreciation in the next six to 12 months. The bigger discount provides them with a bigger cushion to hedge against this slowdown.
The fact that the average discount in Q4 2022 was seven percentage points higher than the pre-pandemic average suggests that buyers expect home price appreciation to go negative given that average home price appreciation between 2015 and 2019 was just 5.4 percent, according to ATTOM Data Solutions.
Nationwide, Auction.com buyer behavior is signaling a negative home price appreciation of less than 5% in 2023, but the risk of a more severe price correction in 2023 is higher in some local markets where the average foreclosure auction purchase discount in Q4 2022 was much higher than the pre-pandemic average.
Among 80 metro areas with sufficient data in the fourth quarter of 2022, those with the biggest increase in purchase discounts relative to their own pre-pandemic averages were Jacksonville, Fla.; Los Angeles; San Diego; Minneapolis-St. Paul; and Riverside, Calif. The average foreclosure auction purchase discount in these five markets was at least 19 percentage points above the pre-pandemic average.
Foreclosure auction buyer behavior is signaling a possible home price correction in 2023 in 50 of the 80 markets, but some notable exceptions include Chicago, Philadelphia, Virginia Beach, Va., Cincinnati and Miami.
2. Home sales bottoming out as sellers eventually capitulate on price
Auction.com buyers are demanding a deeper discount on distressed property purchases, and they’re willing to walk away from a deal when they can’t realize that deeper discount. This is evident in foreclosure auction sales rate data from the Auction.com platform. The sales rate — simply the percentage of properties available at foreclosure auction that end up selling — dropped quickly in the second half of 2022 after spiking earlier in the COVID-19 pandemic.
While still above pre-pandemic averages, this rapidly falling sales rate signals a paradigm shift from seller’s market to a buyer’s market. This paradigm shift is being mirrored in the retail market in the form of plummeting home sales, which had declined for 10 consecutive months through November 2022 — the longest string of consecutive declines on record, according to the National Association of Realtors (NAR) data going back to 1999.
The shift to a buyer’s market is driven primarily by rising mortgage rates. Assuming mortgage rates do not drop substantially in 2023, sellers will eventually need to capitulate on price to adjust to this new reality.
Retail sellers are typically slower to adjust pricing due to their emotional connection to the property, but distressed property sellers don’t have that emotional connection and are typically more responsive to market conditions. Sellers on the Auction.com platform are already showing some early signs of pro-active price adjustments, a trend that will likely be reflected in the retail market in 2023.
Foreclosure auction sellers set their credit bid — the minimum amount they will accept to sell the property — at 70% of estimated “as-is” market value on average in the fourth quarter of 2022, down from 73% in the previous quarter and down from a pandemic peak of 83% in the fourth quarter of 2020. The 70% average credit bid in Q4 2022 was the lowest level as far back as the Auction.com data is available, Q1 2012.
As retail sellers eventually follow the lead of distressed sellers and adjust their listing price lower in 2023, home sales will bottom out and begin rising again, most likely in the second half of the year.
This column does not necessarily reflect the opinion of HousingWire’s editorial department and its owners.
To contact the editor responsible for this story:
Sarah Wheeler at sarah@hwmedia.com
Source link
Housing Market Tracker: A notable drop in inventory
The housing market saw inventory fall 4% last week from the week before. That’s a big one-week change. Does that mean we are heading back to all-time lows in inventory again for 2023?
Traditionally, we do see housing inventory fall in the month of December, however, we clearly saw in the second half of 2022 that higher rates created more days on the market and inventory was lingering longer. During the last four weeks and especially this past week, we are seeing inventory decline faster than expected.
So, is this the traditional seasonal decline we see during every December/January, or have falling mortgage rates (since mid November) contributed to this? The purchase application data will help us find the answer. Purchase application data corresponds to future demand, meaning that even when the number of applications is growing, we won’t see it in sales data until 30-90 days out. This is why we need to track it on a weekly basis.
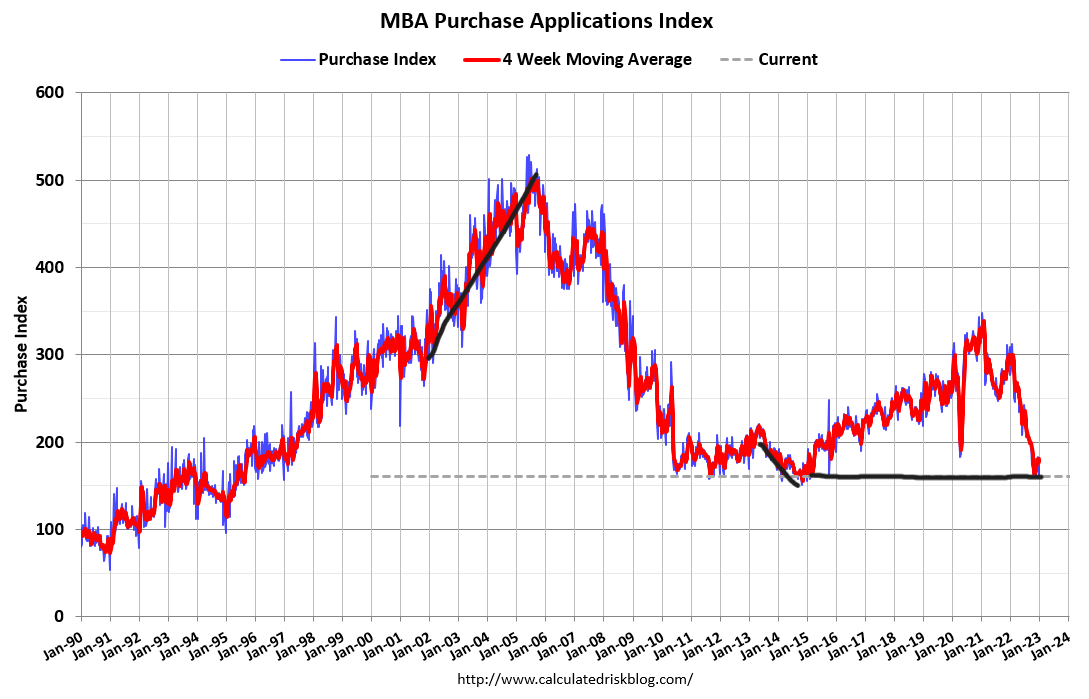
Purchase application data
Usually, I wouldn’t put much weight in data for the last week and the first week of the year because it’s seasonally the slowest period. However, even with a seasonal decline in volume and the fact that many people don’t apply for a mortgage during the holidays, there is something to be seen here because the data line snapped a seven-week positive trend as mortgage rates rose toward the end of the year.
Before these two weeks, purchase applications had seven weeks of positive data, tracking with the drop in mortgage rates from 7.37% in November to 6.12%. Then rates rose toward the end of the year to back over 6.5%: that rise in rates could have facilitated the weaker purchase application data in the past two weeks.
Since purchase applications deviated from the trend and changed with higher rates, we have to pay attention to that. Now that mortgage rates have fallen again, the next few weeks will provide more clarity.
Purchase application data is very seasonal in a standard setting: it typically rises after the second week of January through the first week of May. Traditionally after May, total volume always falls. However, the year-over-year data is still critical to keep track of for the housing market.
We have to show discipline here; this data line had a historic waterfall dive, wiping out seven years of gains in one year (see chart below). The bar is so low that we can all trip over it, so the weekly data focus will be critical.
Weekly housing inventory
As noted above, the last few weeks have seen a noticeable 4% decline in inventory. Most of that decline can be attributed to the yearly seasonal decrease. If purchase application data started to improve toward the end of the year, and it looks out 30-90 days, then some of the inventory clearing can be attributed to better demand, not just the seasonal decline in inventory.
Altos Research gives us a fresh look at weekly data before the traditional outlets give us that data line. As we can see in the chart below, the weekly inventory data is now heading down more noticeably. We want to see whether this weekly data stops declining before the spring seasonal push in inventory or if we will have a repeat of the second half of 2022, where we saw a lack of new listing growth. That mean homebuyers would have slim pickings again for the spring buying season.
What we don’t want to happen this year is a decline in new listing data on a yearly basis. We saw that after June 2022, and that showed me that the housing market wasn’t functioning normally.
We are on the cusp of breaking under 1 million total active listings, and if this happens in 2023, it will be only the second time in recent history this has occurred.
Per the last existing home sales report, we have 1.14 million homes for sale. Historically, the U.S. has between 2 million and 2.5 million. During the height of the housing bubble years, we had 4 million.
10-year yield and mortgage rates
The big story of last week was that after the solid jobs report, the 10-year yield fell lower, sending mortgage rates down to 6.20%. The bond market likes to see wage growth cooling down because if headline inflation is falling and wage growth is falling, the bond market is looking for the end of the rate-hike cycle.
Since the November CPI report, it’s been hard for the 10-year yield to break above 4.25%, and the bond market has decided that the peak growth rate of inflation has already happened, even with the labor market still tight.
I think the bond market is getting ahead of the Fed with the inflation story. We still have a tight labor market and mortgage rates are already falling. Now imagine if the labor market data get weaker, which is part of the Fed’s forecast. It’s hard to conceive now that mortgage rates would get up toward 8%.
This is a critical discussion for housing because the housing market is impacted disproportionately when rates fall during recessionary data. After all, most homeowners, buyers, and sellers who will buy homes are still employed during any traditional recession and can leverage lower rates to help affordability.
The week ahead
What we want to do with this weekly Housing Market Tracker is see the most current update to demand when rates rise or fall with purchase application data.
This week, we have some crucial data lines; they will come out on Thursday morning with the Consumer Price Inflation data and jobless claims. Inflation levels are still historically high, however the growth rate of inflation should slow down over the year.
The chart below tracks the Consumer Price Index and as we can see, it peaked in 2022 and it’s slowly moving lower now. The Federal Reserve has cautioned everyone not to read too much into the positive data that inflation is falling. However, if this trend continues, mortgage rates won’t be spiking higher.
Regarding the Fed pivot, although everyone talks about it, it’s a no-go until jobless claims break over the 323,000 level on a four-week moving average. Right now we are nowhere close for that level to break. Jobless claims fell in the most recent report, and the headline number fell to 204,000, while the four-week moving average is 213,500. Therefore, I don’t expect the Fed’s language to change much until the labor market breaks.
Continuing claims is another important weekly data line to track: it shows Americans who have filed for jobless benefits but haven’t been able to find a job in over a week. This number stabilized in the last report, but it has had a more noticeable rise than initial claims.
How these data lines hold up is critical to the mortgage rate/bond yield discussion. If the bond market is getting a whiff that inflation has peaked, imagine how it will act when the labor market breaks negative. Traditionally, post-1982, this means bond yields — and mortgage rates — will go lower.
To sum it up, inventory is falling like it usually does at this time of the year, but some of that inventory can be tagged to the current better demand from lower mortgage rates. In time, we should see the spring seasonal increase; if we don’t see that this year, that is a double net negative for the housing market.
Seasonal increases are the norm each year outside of 2020 because of COVID-19. I’m a big fan of getting inventory back to 2019 levels to have a buffer if rates fall and demand gets better, which would take inventory lower.
On the economic front, it’s inflation and labor; the inflation data looks like it has peaked, but the jobs data is still solid. We have a double treat this week, with inflation and labor data both coming out at the same time Thursday morning.
If you haven’t checked out my 2023 forecast, read that here. Also, I’ll be joining Altos Research President Mike Simonsen for a virtual Housing Market Update on Feb. 6.
Source link
Build-for-rent is a bet on the ‘new normal’ housing market
One slice of the single-family home market that has gained traction over the past year in a topsy-turvy housing landscape is the build-for-rent sector — or BFR.
Construction starts in the BFR market are being propelled by the ongoing demand for single-family rental units as high mortgage rates and limited for-sale inventory push home-purchase prospects further out of reach of many would-be homebuyers.
Still, even the single-family rental (SFR) market, including the BFR sector, faces an uncertain future in the year ahead, given the ongoing volatility in interest rates and inflation. Both pose threats to access to capital, the cost of materials and labor, and future housing values.
Through much of 2022, however, build-for-rent housing remained a hot ticket, with supply continuing to increase, “even with the economy showing signs of volatility and capital costs increasing,” according to a November special report from Minneapolis-based Northmarq.
“Developers are forecast to start 74,000 [BFR] units in 2022, up from 59,000 units in 2021,” states the report by Northmarq, a capital markets leader with some $33 billion in annual transaction volume and a loan-servicing portfolio of more than $76 billion. “… The number of units delivered this year is on pace to rise 21 percent, to 64,000 units [compared with 53,000 units in 2021].
“With many homebuilders feeling the impact of rising mortgage rates on new-home sales, delivering units for rent is expected to continue to become a larger segment of the overall single-family housing market.”
The Northmarq report points out that the BFR sector currently accounts for only a small slice of overall home starts, at about 6%. A recent report by MetLife Investment Management estimates that there are about 14 million SFR homes nationally, including the BFR sector.
“The softer for-sale housing market, particularly for new homes, is expected to allow single-family rental operators to acquire blocks of new homes, finished lots and larger land parcels from homebuilders,” Northmarq’s market report adds.
The National Association of Home Builders (NAHB) also recognizes the potential of the build-for-rent (BFR) sector. It’s “Eye on Housing” report published in mid-November indicates that there were 68,000 BFR construction starts over the four quarters ending in Q3 of 2022, up 42% compared with 48,000 such starts during the prior four-quarter period.
“While the market share of [single-family] BFR homes is small, it has clearly been trending higher,” the NAHB report continues. “As more households seek lower-density neighborhoods and single-family residences, a growing number will do so from the perspective of renting.
“This will be particularly true as mortgage interest rates remain elevated and increase. Thus, the [single-family] BFR market will expand in the quarters ahead.”
Riding a cresting wave
Single family rental market leaders that unveiled BFR initiatives in 2022 include Tricon Residential and Progress Residential. The two SFR companies, among the largest operators in the space, announced this past summer that they have thousands of build-for-rent homes planned for development or already in the construction pipeline — some 12,000 on a combined basis. In addition, JP Morgan Chase & Co. and partner New Haven Capital in November announced a $1 billion joint venture to buy and develop SFR properties.
On another front, even multifamily-focused players are getting into the BFR market. TruAmerica Multifamily this past summer launched its own BFR division to develop townhome and SFR communities.
Single-family homebuilders, too, are looking to capitalize on the build-for-rent market, with Lennar Corp., one of the nation’s largest homebuilders, recently offering to sell some 5,000 homes to investors in the SFR market, according to a Bloomberg report. Lennar in 2021, with partners Allianz Real Estate and Centerbridge Partners, launched a subsidiary to acquire and operate SFR and multifamily properties, according to the Bloomberg report.
The surge in build-for-rent single-family housing is coming at a time when there has been a sharp decline in overall in single-family home construction. NAHB attributes that decline to “stubbornly high construction costs (due to inflation), elevated interest rates and flagging demand,” which combined are “harming housing affordability.” Housing starts as of November 2022 were “down 32% since February, when mortgage rates began to rise,” NAHB reports.
Although growing single-family BFR demand is an overall plus for the homebuilding industry, there are economic forces working to dampen enthusiasm for the SFR market as well. Those headwinds also are being fueled by the double-edged sword of high interest rates and stubborn inflation and include declining home values; the prospects of a recession later this year (and with it, rising unemployment); a pattern of moderating rents; and continuing liquidity and fundraising challenges posed by capital-markets volatility.
The Mortgage Bankers Association projects unemployment could reach 5.5% by the end of this year, up from 3.7% as of November 2022. Home prices are already declining and are projected to drop further over the coming year by anywhere from a modest 1.5% on an annualized basis, according to Fannie Mae, to as much as 20%, according to some market forecasts.
“For housing markets, the combined forces of rising interest rates and slower economic growth are weighing on demand and pricing,” Northmarq reports. “New and existing-home sales prices have begun to inch lower, and rental rates in most markets have leveled off.”
Knowing where to build
Ben Hunsaker is a portfolio manager focused on securitized credit for Santa Monica, California-based Beach Point Capital Management, an alternative-credit investment firm with about $16 billion in assets under management as of Sept. 30, 2022. He said in addition to SFR operators starting to see rental growth rates slow, or even decline in some areas, as leases turn over, they also have “seen property taxes and cost structures increase materially.”
“So, the operating metrics that it takes to earn an acceptable return on capital have increased, and so [their] top-line revenue growth needs to be increased, but the actual top-line revenue growth is probably stagnating,” he said. “There’s an argument to be made that there’s a sort of evaluation reset that has to happen for these operating entities in the SFR space, which you see generally reflected to some extent in the public stock prices.”
National real estate brokerage platform Redfin reports that investor home purchases dropped more than 30% year over year in the third-quarter of 2022, which is “the largest decline since the Great Recession, aside from the second quarter of 2020,” at the height of the pandemic. Redfin defines investors as any institution or business that acquires residential real estate. Its report is based on an analysis of county records across 40 of the largest U.S. metro areas.
“Investor purchases slumped 26.1% on a quarter-over-quarter basis, the largest quarterly decline on record with the exception of the start of the pandemic,” the Redfin report notes. “That compares with a 17.4% quarterly drop in overall home purchases.”
NAHB also reported that the BFR home-start mark for the third quarter of 2022 (some 16,000 new homes) is down 6% compared with third-quarter 2021.
Signs of sputtering in the BFR market surfaced as early as August of last year, when SFR company Home Partners of America, controlled by private-equity firm Blackstone Group, announced it was pausing home purchases in a total of 38 markets as of Oct. 1, 2022, according to a CoStar News report. Bloomberg reported in October that another major player in the SFR market, Invitation Homes, was in search of a partner for a $1 billion joint venture. The report added that seeking external capital was preferable to raising money through an equity offering, given at that point the company’s stock price “was down roughly 28%” since the start of the year — and it has continued to drop further since then.
“Headwinds have been gathering with rising financing costs, uncharted inflation, elevated geopolitical risks, and increasing concerns about a general economic recession,” states a September 2022 report on the SFR securitization market by Kroll Bond Rating Agency. “Should these factors lead to meaningful declines in home prices, rental rates and/or operating margins, the [SFR] sector will be subject to stress it has not previously encountered.”
That stress is already present in the homebuilding market, according to Stuart Miller, executive chairman of Lennar Corp., who was among the executives presenting at the homebuilder’s recent third-quarter earnings call.
“Our current view is that production of single-family and multifamily dwellings nationally will be down between a quarter to a third in 2023, exacerbating the national housing-supply shortage,” Miller said during the Dec. 15, 2022, earnings call. “Numerically, that means that approximately 1.5 million homes produced over the past couple of years per year will drop to around a million homes produced.”
“… While our [home-sale contract] cancellation rate of 26% is decidedly higher than the 12% last year, it has been falling from the peak of 28% reached in October, and we expect it to normalize below 20% in the near future,” he added.
Hunsaker pointed out that if you’re a builder in the current market, your options include “shelving the land that you’ve banked or that you’ve optioned to build up, or building it up … and selling it to one of these build-for-rent aggregators as an SFR.”
“… So, I think there’s joint incentive structures there that make [BFR] a hard art asset class to wrap your hands around.”
With that said, Hunsaker said the BFR market is becoming much more a game of geographic chess, adding that “there are great places for build-for-rent and there are awful places for build-for-rent.” He points to Florida, a long-time hot SFR market (along with the southern Sunbelt states generally), as an area where there are now many not-so-good places to pursue BFR communities.
“You’re not land-constrained” in terms of building opportunities in many Florida communities, he said, and there already has been a lot of SFR development and activity — plus, he added, “you have this really hard-to-measure impact for insurance … post-hurricane.”
The Northmarq report indicates that year to date through October of 2022, BFR construction starts in the South generally have accounted for “63 percent of the national total, up from 61 percent in 2021.”
“It [BFR] has become very regional, community by community, city by city,” Hunsaker added. He said it takes a high level of sophistication to capitalize on the market now, pointing to JP Morgan Chase, a relatively new BFR sector entrant via its recent joint venture with New Haven, as an example of a player that likely has the market intelligence to make good bets.
In the build-for-rent zone
Doug Faron, one of three founding partners at Florida-based Shoreham Capital, a BFR and multifamily residential developer focused on markets in the Southeast, agrees with Hunsaker’s take on the direction of the market. But he and his partners — all longtime industry veterans — also believe plenty of opportunities still exist in even crowded SFR markets like Florida.
Among the projects the company is developing is a 175-unit build-for-rent community called The Preserve at Poinciana, which is south of Orlando and slated to start construction in the second quarter of 2023. Shoreham also is developing a more traditional 412-unit multifamily community, called Siesta Lakes, in Cape Coral, Florida, which is set to start construction in the first quarter of this year.
Faron launched Shoreham early last year along with fellow Shorehaven founding partners Nick Zoumas and Steven Figari. Zoumas also is the founder and president of JNS Homes, a West Palm Beach, Florida-based homebuilder with some $1.25 billion in completed construction projects.
“We are partnered with institutional and family office or pension-backed capital to develop these [BFR] assets and hold them in certain instances,” Faron explained in discussing Shorehaven’s BFR strategy. “And we are also selling to what is likely the institutional market on the backend, given the scale these communities [is of a] a size that of fits within that market.”
Faron and Figari, in a recent interview with HousingWire, stressed that Shoreham is focused on developing build-for-rent communities that are more like multifamily projects — and developing them in the right areas. Faron explained that Shoreham’s single-family build-for-rent projects offer many of the same perks that are a staple in large, more upscale apartment complexes — including onsite management and amenities such as gyms and swimming pools.
“Those are the of amenities that people have become accustomed to, especially millennials [now young adults] who are used to living in apartments,” he said.
Figari added that “over time, people will start to see and look at this strategy of what we’re building as being very similar to multifamily, but at the same time you get the benefits of that single-family home.”
Faron said Shoreham is looking at investments across the Southeast, including in Florida, because they are “bullish about the growth there.”
“We certainly have to take into account rising insurance costs [in Florida],” he added, but Faron said there are plenty of unique geographic pockets in a state like Florida, and the Southeast at large, with strong population growth and related strong rent-growth prospects. As an indicator of the growth in West Palm Beach, where Shorehaven is headquartered, Faron said traditional office space has doubled over the past three years.
“People need housing, they need a place to live, and we’re trying to hit an approachable price point with a better product,” Faron said. “… The millennial population is moving toward household formation, and that is requiring them to want yards and garages, and so we think the trend is [toward] larger living units.
“We are really focused on making sure that we’re building the right product [in the right place] for people that can afford to be in there,” he added.
The Northmarq report points out that while the economic picture for build-for-rent projects dimmed as 2022 progressed, “the short- and medium-term outlooks for single-family build-to-rent properties have remained attractive.”
“Renter demand for these homes is being fueled by demographic trends as millennials age and their housing needs change,” the Northmarq report concludes. “… Residents are expected to continue to demand new, single-family rentals, particularly as the affordability of for-sale housing grows further out of reach.”
Source link