New home sales defy recession calls
New home sales are up 20% year over year, and existing home sales are down 20% year over year; this is something we don’t see very often. One group has the advantage here while the other doesn’t: The new home sales market is minuscule versus the existing one, and the builders sell their homes like a commodity.
Last year a theme of mine was that new home sales are historically low, and the builders know how to move products when needed. This means they will cut prices, buy down rates, and do whatever it takes because they’re in business to make money. They have no emotional ties to houses and don’t need to sell a home to buy another one. They’re effective sellers and don’t want to create a backlog of completed units for sale because that would ruin their business model.
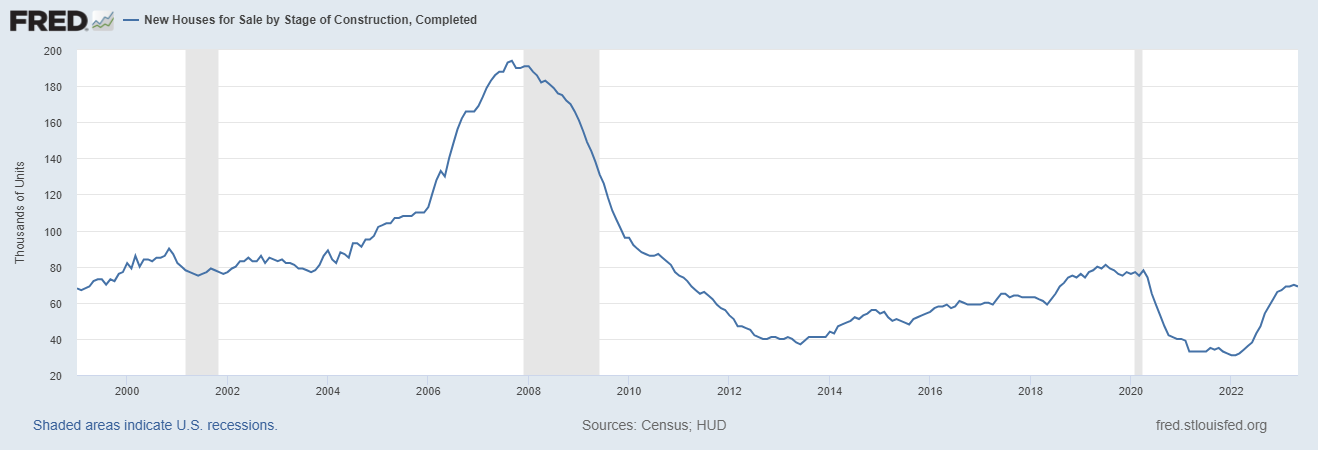
Case in point: Today we have 69,000 new homes completed and ready to sell, as shown below. The builders have managed their backlog nicely to ensure this data line doesn’t explode higher on them like we saw in 2008. An average number would be around 80,000 homes for sale, so we are returning to normal.
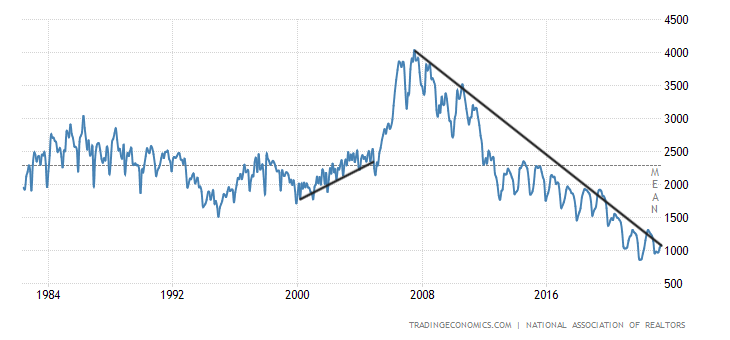
But a bigger story here is that the builders’ biggest competition isn’t other builders — it’s the number of existing homes on the market. Existing homes are cheaper and have a geographical advantage because they’re all over the map. In 2007, we had more than 4 million total active listings, which was too much supply for the builders to compete effectively. Today, the total number of active listings according to NAR is 1.080 million, and that number is down year over year.
NAR total active listings data going back to 1982:
This explains why the builders and new homes are doing better than the existing home sales market, which deals with higher mortgage rates and low active listings. Some people prefer something other than the current active existing inventory. This means new homes — with all the bells and whistles — can peel some buyers from the existing home sales market, especially if they pay down mortgage rates.
Now on to the report.
From Census:
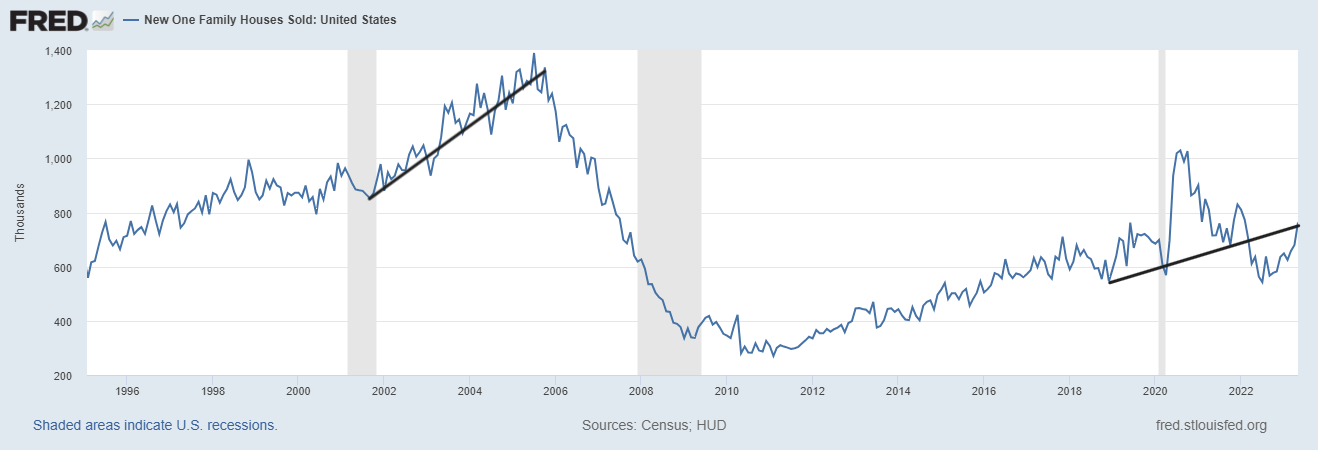
New Home Sales: Sales of new single‐family houses in May 2023 were at a seasonally adjusted annual rate of 763,000, according to estimates released jointly today by the U.S. Census Bureau and the Department of Housing and Urban Development. This is 12.2 percent (±12.8 percent)* above the revised April rate of 680,000 and is 20.0 percent (±15.5 percent) above the May 2022 estimate of 636,000.
As we can see in the chart below, new home sales aren’t booming like what we saw at the peak of 2005 but are getting back to trend sales growth from the bottom we saw when rates got 5% in 2018. New home sales can be wild monthly, so if we see some negative revisions to this report, just remember: it’s the trend that matters, and it’s gotten much better here.
Also, in the chart below, we can all agree it isn’t housing 2005 or housing 2008 with new home sales.
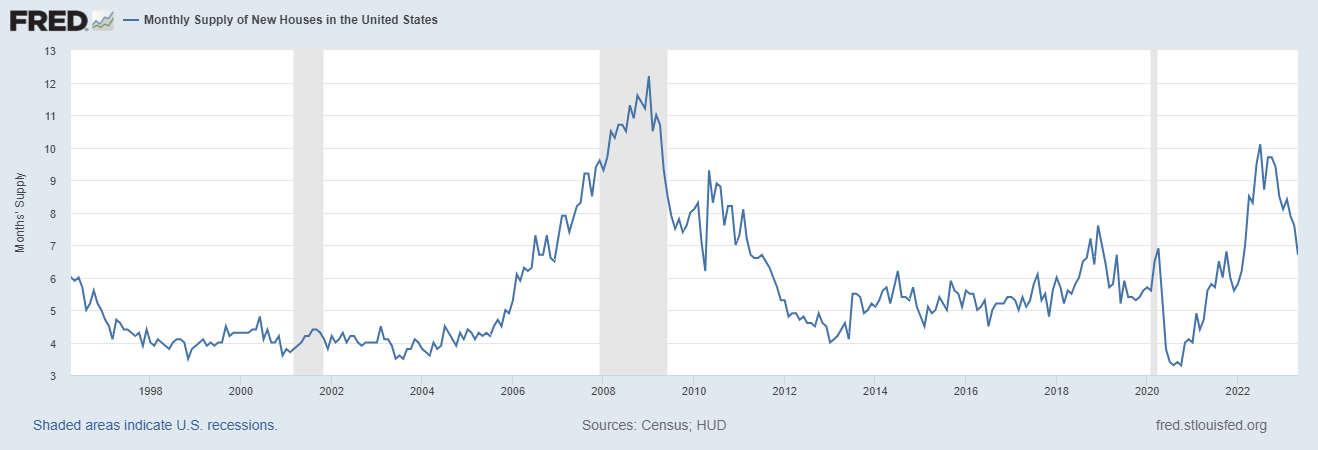
For Sale Inventory and Months’ Supply: The seasonally‐adjusted estimate of new houses for sale at the end of May was 428,000. This represents a supply of 6.7 months at the current sales rate.
As home sales improve, the builders are winding down their monthly supply, which is good for the economy. I have a straightforward model for when the homebuilders will start issuing new permits with some kick. My rule of thumb for anticipating builder behavior is based on the three-month supply average. This has nothing to do with the existing home sales market — this monthly supply data only applies to the new home sales market and the current level of 6.7 months.
Housing permits will follow since this data line improves as new home sales keep growing. The model below has been my bread and butter for years:
- When supply is 4.3 months and below, this is an excellent market for builders.
- When supply is 4.4-6.4 months, this is just an OK market for builders. They will build as long as new home sales are growing.
- When supply is 6.5 months and above, the builders will pull back on construction
The current data has seen significant improvement, as the chart below shows. Also, the only bubble crash this year has been in cancellation rates, not existing home sales prices.
Also, it’s vital to break down the monthly supply data into different supply categories.
- 1.1 months of the supply are homes completed and ready for sale, about 69,000 homes
- 4.1 months of the supply are homes that are still under construction, about 259,000 homes
- 1.6 months of the supply are homes that haven’t started yet, about 100,000 homes
This is a solid report today as the builders are moving products and making deals to get buyers in. I love it.
Housing has always been used as an indicator of the economy. As the builder confidence data rose, many pessimists ignored it because they assumed it was a dead-cat bounce. Now that we are almost to July 4, 2023, it’s a wake-up call. I ask my bearish friends who use housing as a leading indicator going into recession and out what they believe the data is telling them now. So far, I haven’t heard back.
Home Builder Confidence Index
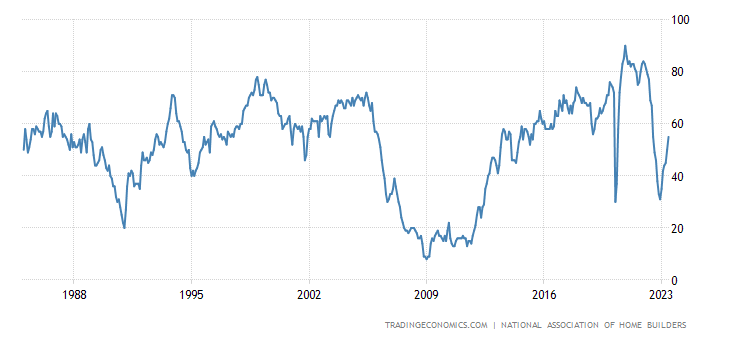
The builder’s confidence index is gold because the builders are thinking about making money, whereas some indexes might have a political or ideological twist. I track the builders’ confidence and the 10-year yield because these two are essential for housing. This report is a plus for the economy because construction worker employment risk will decrease if sales continue to higher and mortgage rates can fall.
This article aims to show how much progress we have made in this sector and why it’s happening. The report today is a positive story for the U.S. Hopefully, this trend continues because the best way to deal with inflation is always with supply, not demand destruction. Demand destruction is a short-term fix, but supply needs to grow over time to beat inflation.

 :215-447-7209
 : deals(at)frankbuysphilly.com
