
Jobs data shows the truth about the labor market
We’ve had some odd job reports over the years, but the key is to always follow the trend. That’s especially important with Friday’s data, which showed 339,000 jobs were created in May even while the unemployment rate increased.
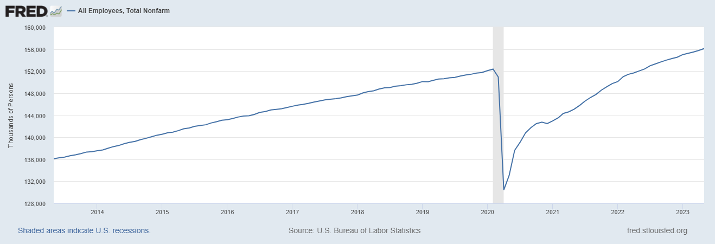
As someone who wrote that we should get job openings toward 10 million in this expansion, I am always mindful of my other labor talking point. If COVID-19 didn’t happen, the total employment numbers in the U.S. today should be between 158 million and 159 million, or in a weaker labor market growth scenario, between 157 million and 158 million.
Today, we stand at 156,105,000, so I think we are still in make-up mode until we reach a range acceptable to a fast economic recovery.
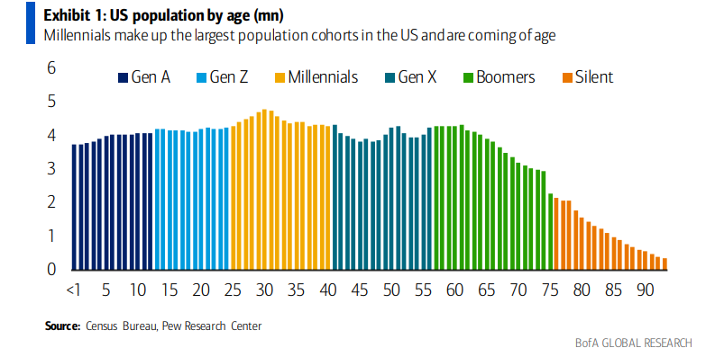
That’s why the jobs data has beaten expectations 14 months in a row. What the U.S. has that other countries don’t is a massive young workforce. While population growth is slowing here, we have the demographic muscle that other countries don’t have — if we didn’t have that, our economic discussion would be different.
Now let’s look at the labor market on all fronts from the data we got this week to get a comprehensive view of the labor market today. On Friday the BLS reported job growth came in at 339,000, with positive revisions, while the unemployment rate went higher, as there was a drop in self-employed workers.
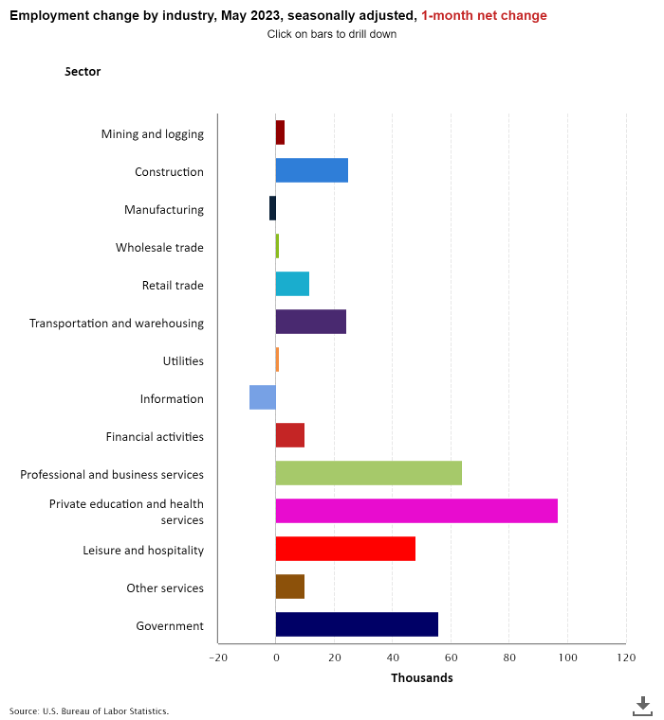
From BLS: Total nonfarm payroll employment increased by 339,000 in May, and the unemployment rate rose by 0.3 percentage point to 3.7 percent, the U.S. Bureau of Labor Statistics reported today. Job gains occurred in professional and business services, government, health care, construction, transportation and warehousing, and social assistance.
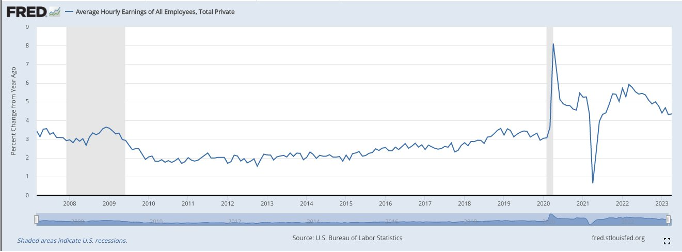
Hours worked have fallen in the last few months, and wage growth is slowing. The fear of 1970s-style inflation was that wages could grow out of control in a tight labor market. In theory, 2022 and 2023 are tight labor markets and wage growth is slowing down. This trend should continue for the next 12 months as well.
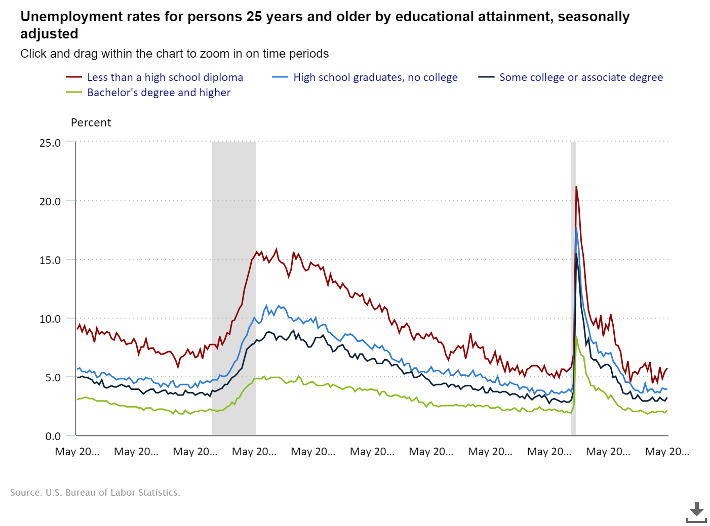
Here is a breakdown of that data for those aged 25 and older:
- Less than a high school diploma: 5.7% (2 months ago, 4.8%)
- High school graduate and no college: 3.9%
- Some college or associate degree: 3.2%
- Bachelor’s degree or higher: 2.1%.
The noticeable data line here is that the unemployment rate for those without a high school education is up almost 1% from two months ago.
Here is the breakdown of the jobs created this month, another big month for the government, which typically doesn’t continue at this pace. Construction labor has held up very well, even though housing permits have been falling for some time. The backlog from COVID-19 has been a jobs program for the U.S. as we are still slowly growing the housing completion data.
So the BLS jobs report is still pushing along, while wage growth is slowing down. Jobs Friday is one piece of the labor pie — we have two other data lines that we always need to keep an eye on to know the health of the labor market: job openings and jobless claims.
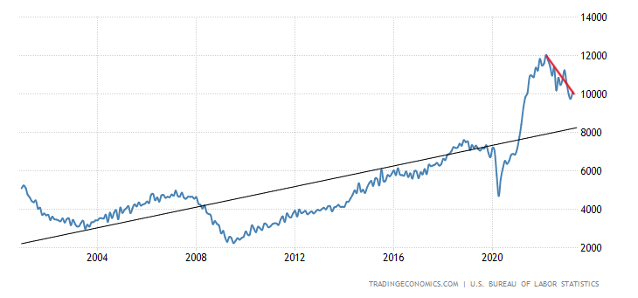
As the only person on Earth who talked about job openings data getting to 10 million in this recovery, I am surprised that job openings data is still around that mark. But that is off the recent highs of 12 million.
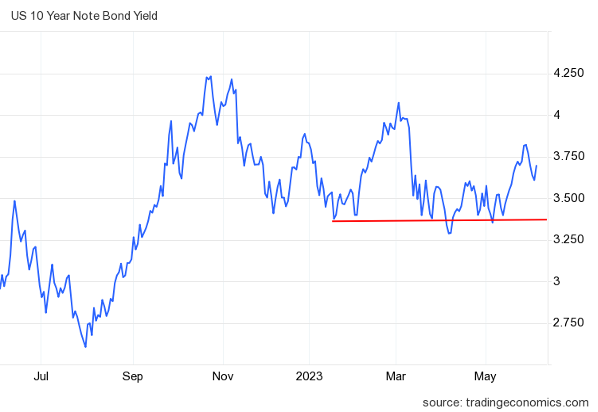
At this point of the economic expansion, I am putting more weight on jobless claims data than job openings (JOLTS). For me, the Fed doesn’t pivot, or the 10-year yield doesn’t break under 3.21%, until jobless claims break over 323,000 on the four-week moving average, and that isn’t happening either.
As we can see below, the Gandalf line in the sand has held up the entire year, even though it was tested many times.
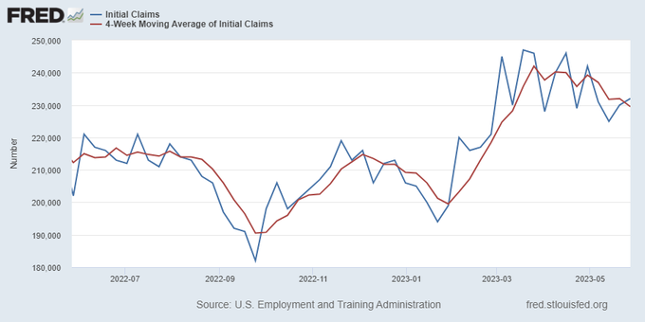
As we can see below, the jobless claims four-week moving average is still far from breaking over 323,000. I chose that number using many different variables as I think when we crack about that level, it will be noticeable to everyone — even the Fed — that the labor market has broken.
From the St. Louis Fed: Initial claims for unemployment insurance benefits increased by 2,000 in the week ended May 27, to 232,000. The four-week moving average declined, to 229,500.
It’s important to understand the labor dynamics of this economic expansion. We had such a shock in the economy with COVID-19 and a strong labor market recovery that the make-up labor demand, which doesn’t get talked about much, is a significant reason we still see healthy numbers.
Also, it’s essential to understand the demographic difference now and what we had to deal with after 2008. The Baby Boomers are leaving the labor market, and every month that happens, they need to be replaced if demand is growing. This is why having a healthy number of younger workers not only helps with that but also provides replacement consumers, as those who leave the labor market tend to consume a bit differently than younger workers.
At this stage of the economic cycle jobless claims is the data line that matters most. Once jobless claims break above 323,000, then and only then I believe we can talk about a Fed pivot — first in their language and then possibly with rate cuts.
The Federal Reserve is scared to death of the 1970s inflation, and they genuinely believe that breaking the labor market is the best way to prevent that type of inflation from happening. As a country, we are fighting against a group of people stuck in the wrong decade with their economic mindset on inflation.


 :215-447-7209
 : deals(at)frankbuysphilly.com
