
Housing Market Tracker: Rates finally head lower
We finally got a break on mortgage rates last week as the 10-year yield hit a critical level and quickly reversed lower, sending mortgage rates down. Active listings showed growth, week to week, but much smaller than I would like to see. Purchase application data showed some growth weekly, keeping alive the streak of more positive data than negative data year to date.
- Weekly active listings rose by 5,569
- Mortgage rates fell from 7.12% to a low of 6.87%, the recent high was 7.22%
- Purchase apps were up 2% from week to week.
The 10-year yield and mortgage rates
What a crazy few weeks for the 10-year yield and mortgage rates. Last week showed why technical levels matter at certain key stops. As shown below, we hit a key level on the 10-year yield and bounced lower as the CPI report came in as expected.

In my 2023 forecast, I said that if the economy stays firm, the 10-year yield range should be between 3.21% and 4.25%, equating to mortgage rates between 5.75% and 7.25%. The labor market remains healthy as long as jobless claims trend below 323,000 on the four-week moving average. So far, as we can see in the chart below, the 10-year yield channel and mortgage rates have stayed in that range.

If it weren’t for the banking crisis this year, the spreads between the 30-year fixed rate and the 10-year yield would be much better, but that is the reality of the world we live in today. In a normal market, mortgage rates would easily be under 6% with the 10-year yield where it is.
Weekly housing inventory
We had mild inventory growth last week and new listing data is trending at the lowest levels ever. It has truly been the walking dead for inventory growth this year. In fact, last week we were still below the low inventory levels we saw in January, which is crazy because our seasonal increases in spring and summer should always be much higher than in January.
- Weekly inventory change (July 7-July 14): Inventory rose from 464,889 to 470,458
- Same week last year (July 8-July 15): Inventory rose from 487,319 to 508,633
- The inventory bottom for 2022 was 240,194
- The inventory peak for 2023 so far is 472,688
- For context, active listings for this week in 2015 were 1,197,641

As we can see below, the slope of the inventory curve from the seasonal bottom on April 14, 2023, has been so slow that we have negative year-over-year inventory data this year. It also took the longest time ever in 2023 to find the seasonal bottom.
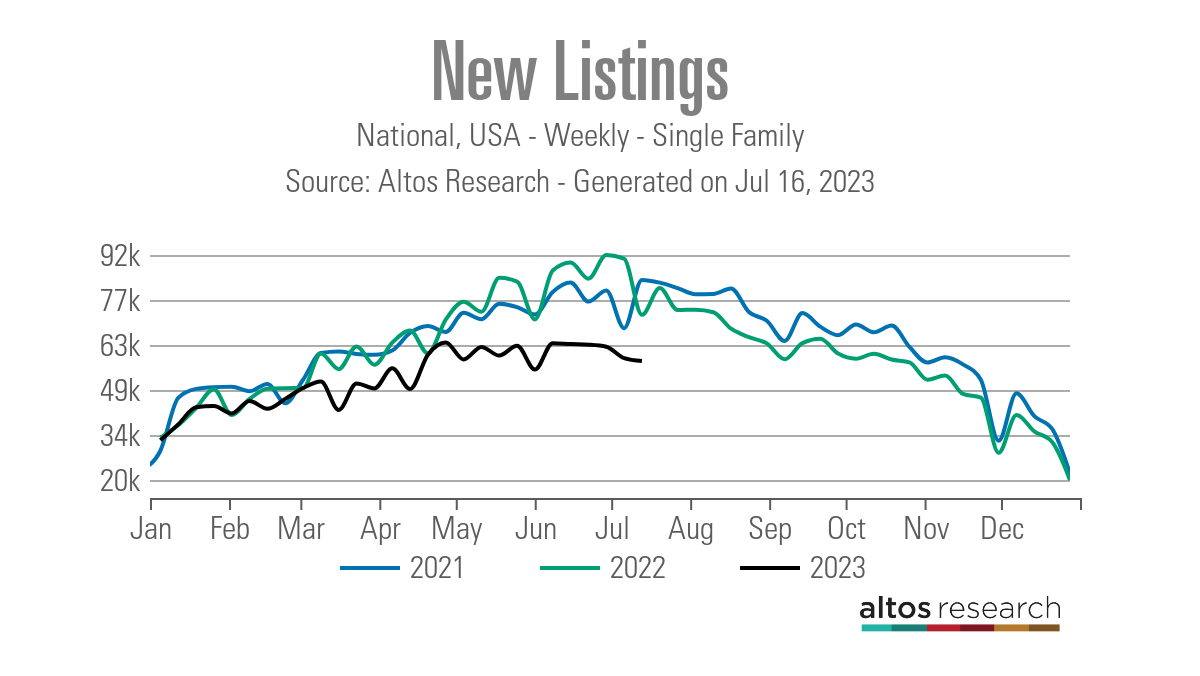
In a few months, we will see the seasonal decline in active listings inventory that we see every year. The new listing data is also seasonal, but its decline happens much earlier, and it looks like we’re entering that period already.

We have had five straight weeks of declines, but they have been mild. This is key because the last thing we want is for new weekly listings to decline significantly when this data line has already been trending at the lowest levels ever for the past 12 months.
- 2023: 57,894
- 2022: 72,553
- 2021: 83,641
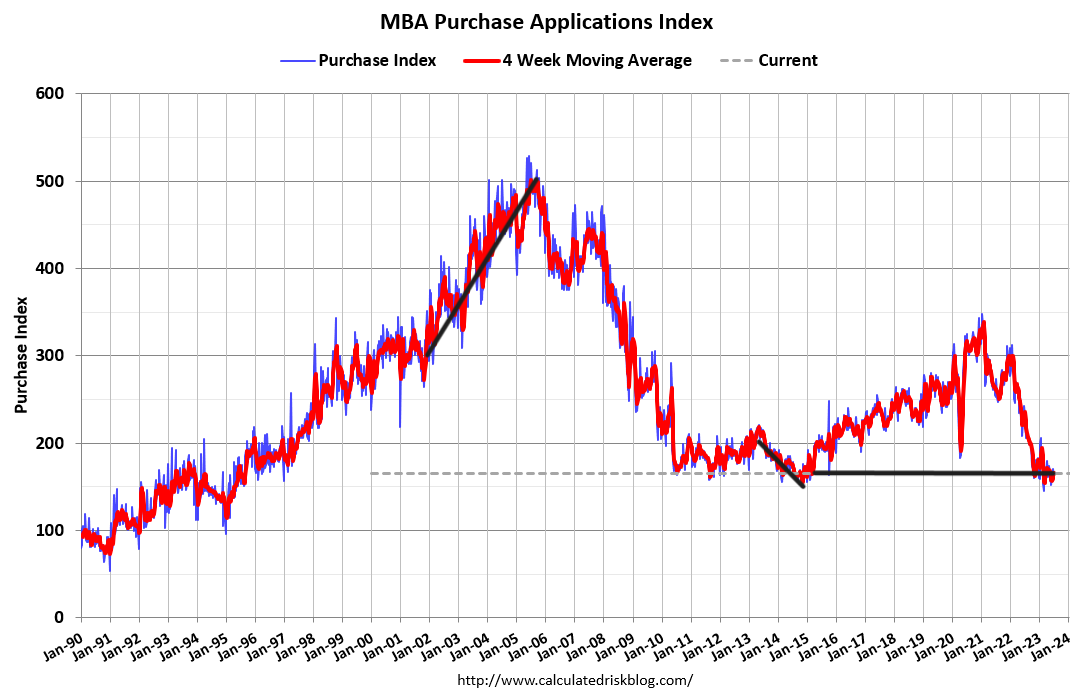
Purchase application data
Purchase application data was down 2% weekly, making the count for the year-to-date data 14 positive and 12 negative prints. If we start from Nov. 9, 2022, it’s been 21 positive prints versus 12 negative prints. The recent push higher in mortgage rates hasn’t created the downfall in this data line like it did last year.
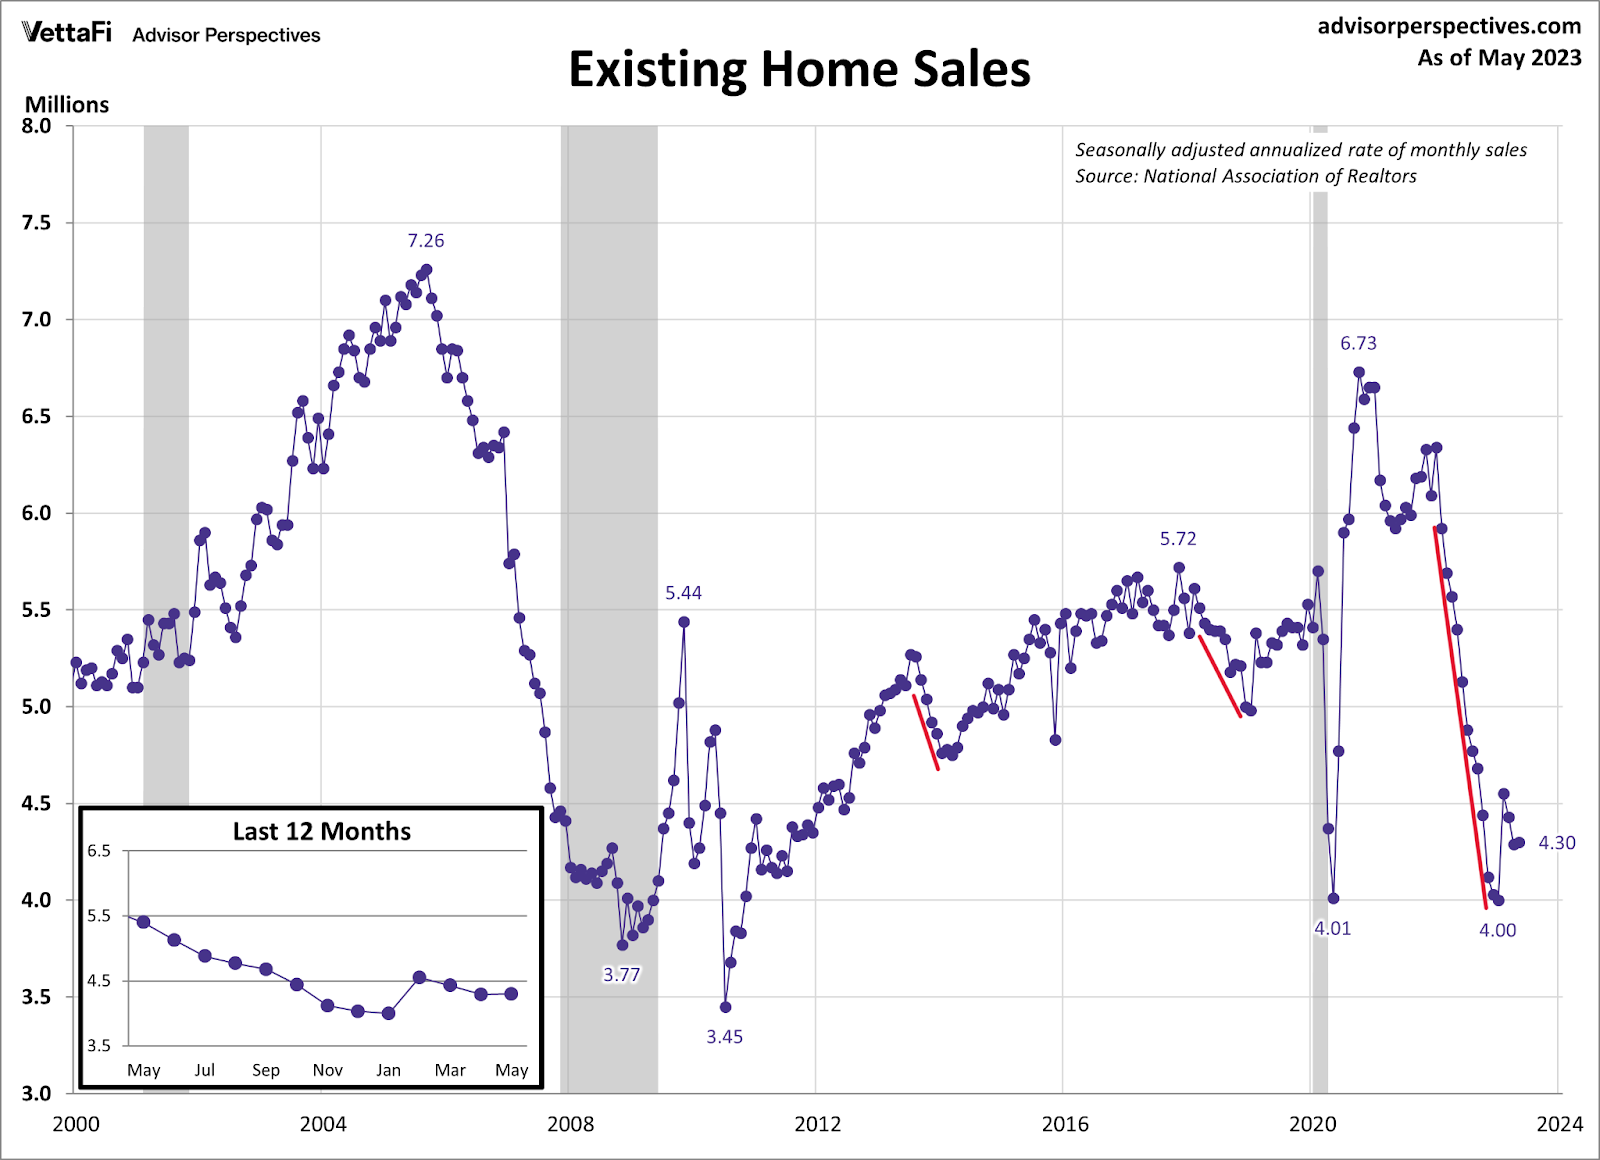
Of course, the big difference in housing this year from last is that home sales aren’t crashing. Since Nov. 9, housing demand has stabilized, and the new home sales sector has shown good growth year over year. The existing home sales market hasn’t gotten much traction as mortgage rates are too high for growth after the one big sales print we had in February.
The week ahead: Housing reports
The week ahead has a host of housing reports: the builder’s confidence index, housing starts, and the existing home sales report will give us a dose of what is happening with the national housing market. On the economic side, we have retail sales on Tuesday and the Leading Economic Index and jobless claims on Thursday, so it will be a busy week on the housing and economic side. I will be interested to see where the 10-year yield and mortgage rates land this week with all these reports coming off the recent highs.


 :215-447-7209
 : deals(at)frankbuysphilly.com
