
Existing home sales now outperforming

The National Association of Realtors‘ existing home sales report for October came in at a solid beat of estimates at 6.34 million. This number is above my trend sales peak of 6.2 million and that means we have had back-to-back existing home sales prints of over 6.2 million. Early in the year, I had discussed that if existing home sales stay in a range between 5.84 million and 6.2 million, that would mean it’s a good year for housing demand.
A big part of my work since the end of 2020 is explaining to people that housing data was going to moderate because the make-up demand from COVID created a surge in sales that is very abnormal. This meant that I had anticipated home sales to fall to a more reasonable range. However, the key was to not overreact to that moderation and say that housing was crashing. This was very common in the previous expansion when any weaker data line trend was interpreted by some people as a housing crash.
As I wrote in my blog in 2020: “The rule of thumb I am using for 2021 is that existing home sales if they’re doing good, should be trending between 5,840,000-6,200,000. This, to me, would be considered a good year for housing.”
I had anticipated a few prints under 5.84 million and so far we have only gotten one print this year below that level. This means with only two more reports left so far in 2021 every single existing home sales print has been higher than the total closing level of 5.64 million in 2020. Not bad considering the low inventory and all that unhealthy home price growth we have seen since the start of 2020.
If home sales moderate from these levels, that would be perfectly normal to me because clearly now the existing home sales market is outperforming my expectations with these last two sale prints. So much for the 2021 forbearance crash bros — the second half of 2021 housing crash YouTube fanatics. Mother demographics and low mortgage rates can crush a lot of American bear’s hearts as they did in 2020 and 2021.
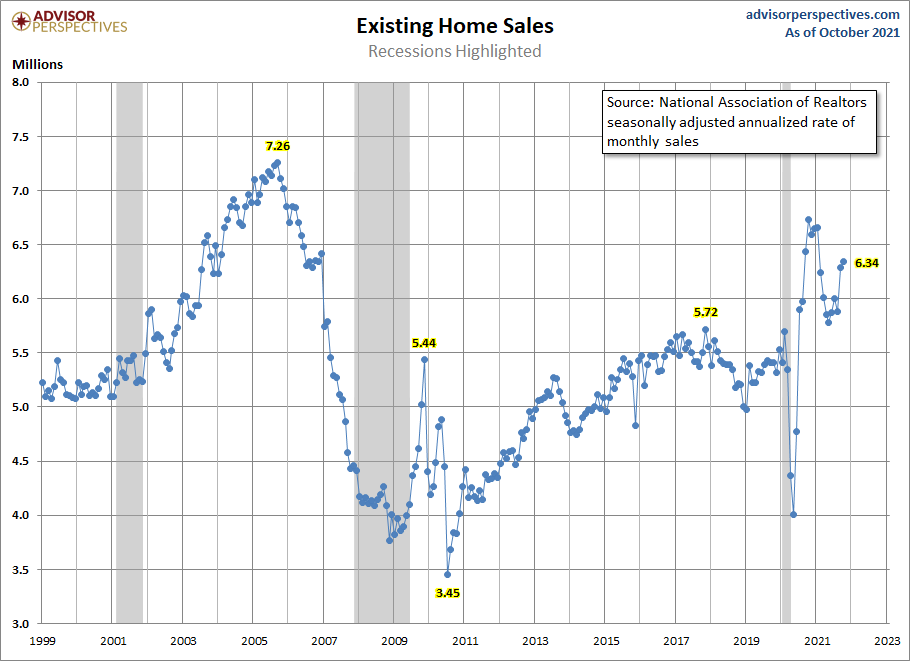
The main reason why housing has done better in the years 2020 and 2021 is that we just got a boost in demand from the most significant housing demographic patch ever in history, as ages 27-33 are the biggest group ever. Then when you add move-up, move-down, cash, and investor buyers together, we should be able to always have total home sales — both new and existing — at 6.2 million or higher. This is something that couldn’t happen in the years 2008-2019. We are well above my 6.2 million total sales numbers and that means both years have been a noticeable beat in my eyes.
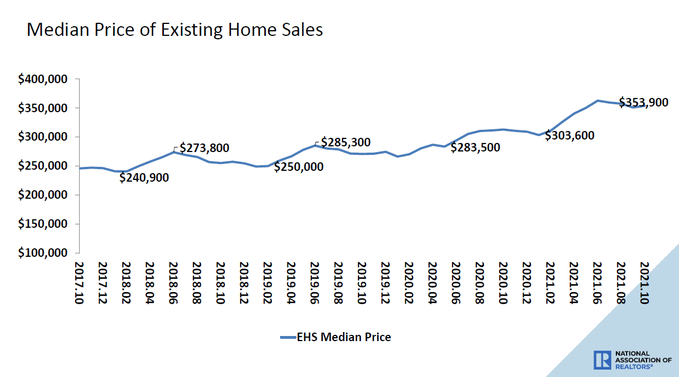
For every positive, there is a risk of a negative and we have seen that risk play out in home-price growth. My single biggest concern for the years 2020-2024 was that home-price growth could overheat and we have seen that take place, which is why I keep on saying this is the most unhealthy housing market post-2010. Not because of a credit housing bubble boom but because days on market are still too low, creating a bidding war frenzy that doesn’t do anyone any good.
From NAR: The median existing-home price for all housing types in October was $353,900, up 13.1% from October 2020 ($313,000), as prices climbed in each region.
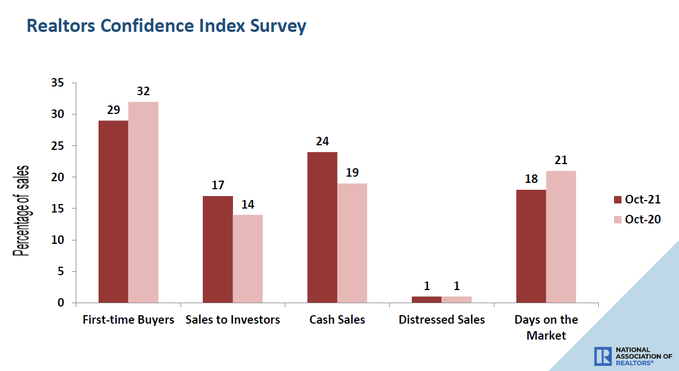
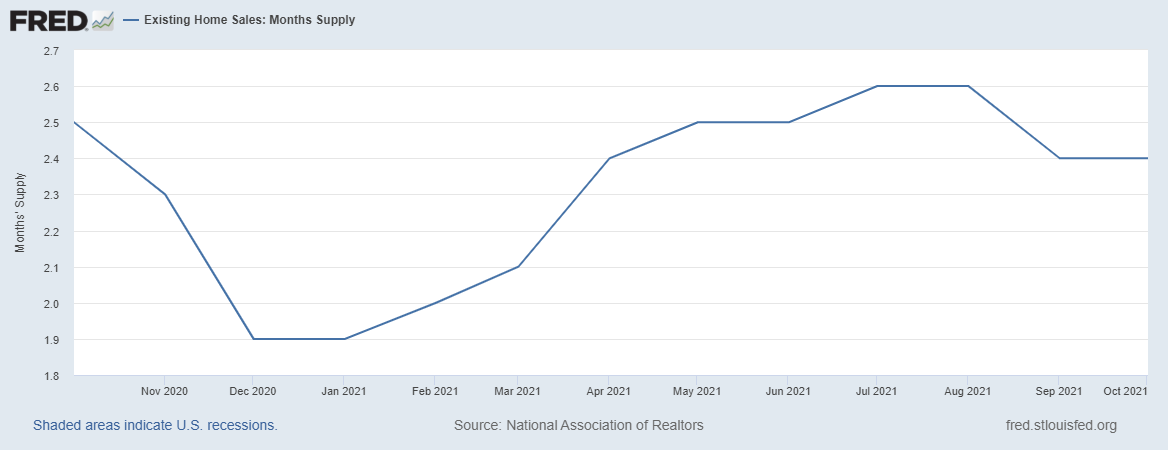
One data set I like to keep an eye on regarding progress for what I want to see in the B&B housing market (boring and balanced) is for days on market to grow. Now we have some good news, the days on market grew one day from the last month’s report, from 17 to 18 days. I know it might not sound like much, but still, progress is progress. I would love to see days on market get to 30 days, so we still have a ways to go for that to happen.
NAR: In October, first-time buyers were responsible for 29% of sales; Individual investors purchased 17% of homes; All-cash sales accounted for 24% of transactions; Distressed sales represented less than 1% of sales; Properties typically remained on the market for 18 days.
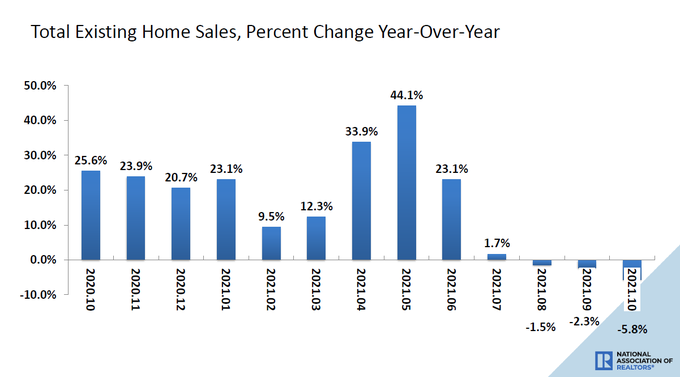
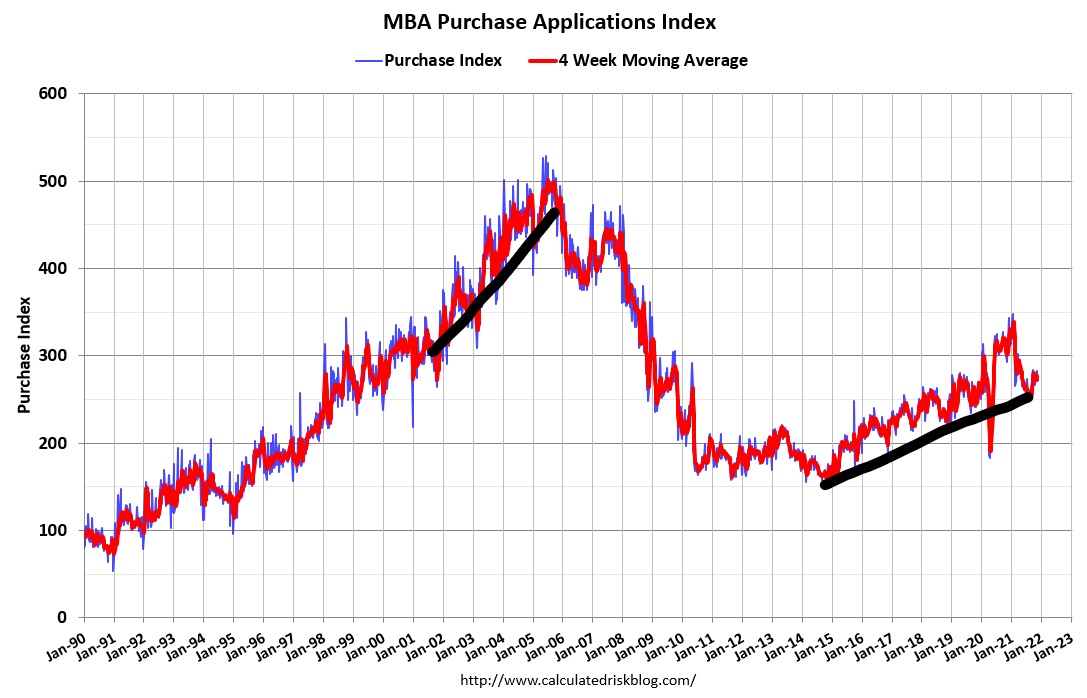
Another theme of mine earlier this year was to expect negative year-over-year data in the MBA purchase applications in the second half of 2021. This is only due to the high comps that we had in the second half of 2020 — all due to the make-up demand from COVID-19. I saw a lot of rookie housing bears try to push this as a reason for housing to fall hard in the second half of 2021. This is a terrible rookie mistake made by people who lack the experience of tracking housing data properly. So, the negative year-over-year data in home sales should not be a shock anymore.
NAR: Sales fell 5.8% from a year ago (6.73 million in October 2020).
There has been a lot of hype that this entire housing market is driven by investors. Dear lord, this Micky Mouse act happens often, but the real driver of housing is mortgage buyers. When mortgage buyers fade — and they will at some point if mortgage rates go higher — so will home sales. We don’t have a Wall Street moat around housing. The MBA purchase application data had been firming up since 11 weeks ago and nobody really cared to notice.
It’s sexier to say that investors are driving home prices higher instead of all those pesky mortgage buyers, which is by far the biggest portion of housing demand. It just doesn’t sell well to say that millennial mortgage buyers are driving home prices to all-time highs. Yellow journalism, gloom-and-doom clickbait sites, and ideological extreme left and right-wing takes get a lot of play, but that doesn’t mean they are right.
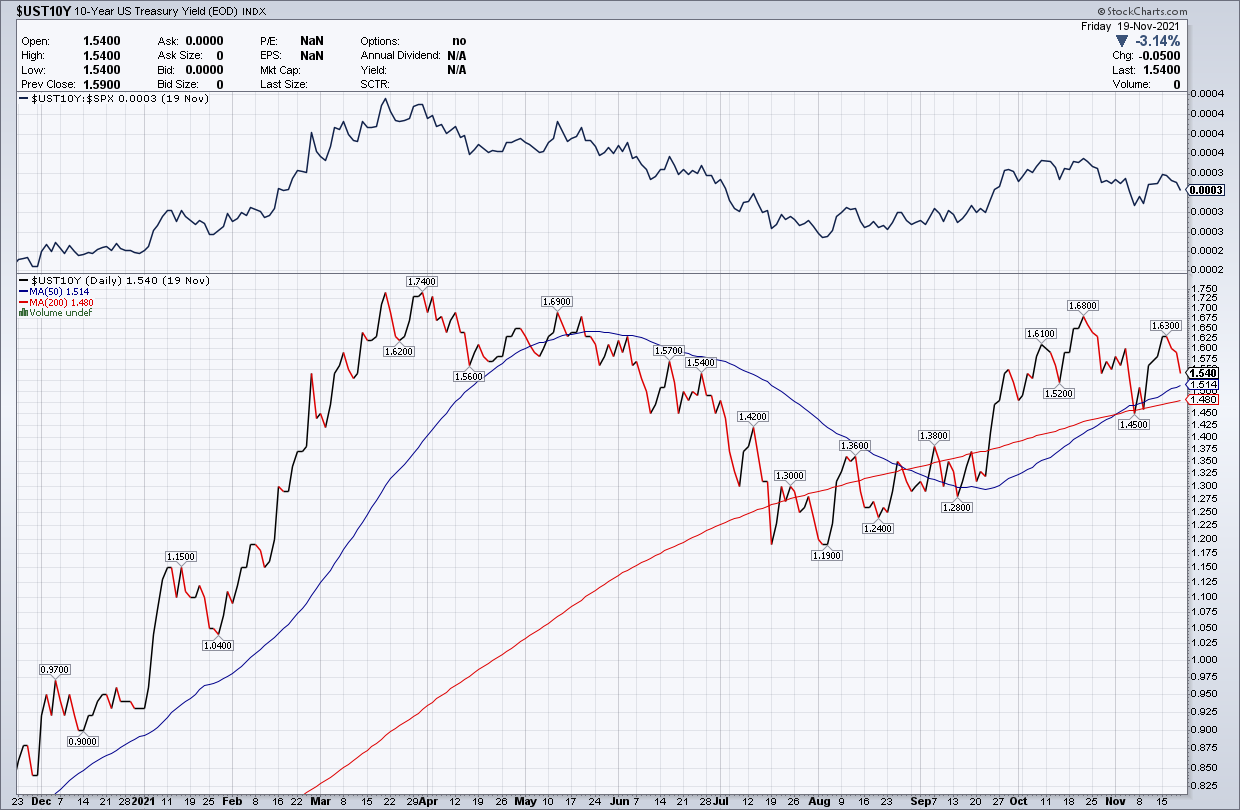
Since the summer of 2020, I had have said housing will slow but it needs mortgage rates above 3.75%, which means the 10-year yield has to get over 1.94%. My 2021 forecast didn’t have that reality in play. In fact, the AB recovery model range of 1.33%-1.60% held its ground for a portion of 2021. Everything remarkably looks right with the bond market for me. As I write this article, the 10-year yield is at 1.60%. Priceless, isn’t it?
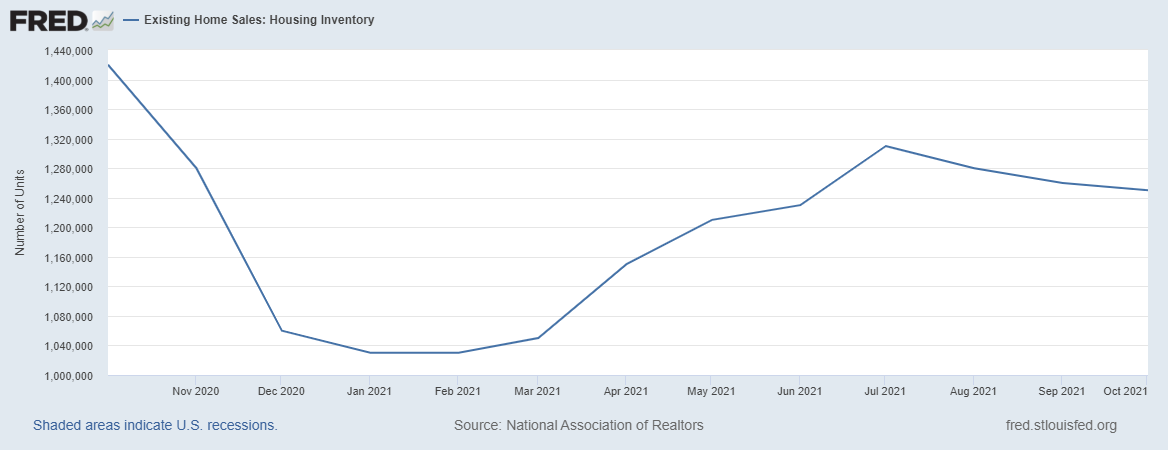
For the rest of the year, I am really watching one thing: I would love to see inventory hold up better than it did last winter. I do not want to see Inventory collapse like it did last year and start the spring of 2022 at those levels. So, that is my focus for the last two reports and the weekly tracking of inventory.
All in all, I would say existing home sales, for now, are outperforming and if sales levels hold above 6.2 million I will be very impressed. If sales trends come down a bit in the next few months, that would fall in line with my sales trend levels. However, the main story for 2021 is that home sales demand is going to end higher than it did in 2020 led by American mortgage home buyers.
The post Existing home sales now outperforming appeared first on HousingWire.
 :215-447-7209
 : deals(at)frankbuysphilly.com