
Don’t get too excited about the jump in existing home sales
We got a great existing home sales report on Thursday, but is this data already too old? Existing home sales showed a jump in sales, which was anticipated by most as we had positive, forward-looking housing data due to mortgage rates falling from 8.03% to 6.63%. However, the last four weeks have had negative trending data. This is nothing dramatic, but similar to what we saw in 2023 when mortgage rates rose from 5.99% up to 7.25%.
But before we address this, let’s look at the report because this report still shows what I have believed for a long time: even with elevated mortgage rates and home prices, lower rates lead to more demand as we are working from historically low levels of sales.
Here are some charts reviewing today’s report with a host of data lines from the NAR existing home sales report:
https://www.nar.realtor/newsroom/existing-home-sales-rose-3-1-in-january
A few critical glaring points: active inventory is still historically low, and so is monthly supply data. This is the timeframe where seasonality kicks in for both to go lower and it will be interesting to see where inventory goes this year with the NAR data. Our data lines here at Housing — which track things weekly — show inventory is growing year over year with new listings growth as well.
From NAR: Total existing-home elevated 3.1% from December to a seasonally adjusted annual rate of 4.00 million in January.
Last year, we had 12 weeks of positive, forward-looking housing data, but it all fell into the March report we got for February, so we had a big jump in sales and a lower trend the rest of the year. This year, we might have a split two-month increase in sales before the forward-looking data takes us lower. The recent existing home sales bounce surprised some people, but the context is critical: we were working from a lower bar in sales this year than last year.
The recent move in mortgage rates from 8.03% to 6.63% pushed the purchase application data positive. Since November of 2023, purchase application data was positive for about eight weeks before it turned negative after rates rose to above 7% again.
From NAR: First-time buyers were responsible for 28% of sales in January; Individual investors purchased 17% of homes; All-cash sales accounted for 32%; Distressed sales represented 2% of sales; Properties typically remained on the market for 36 days in January.
.
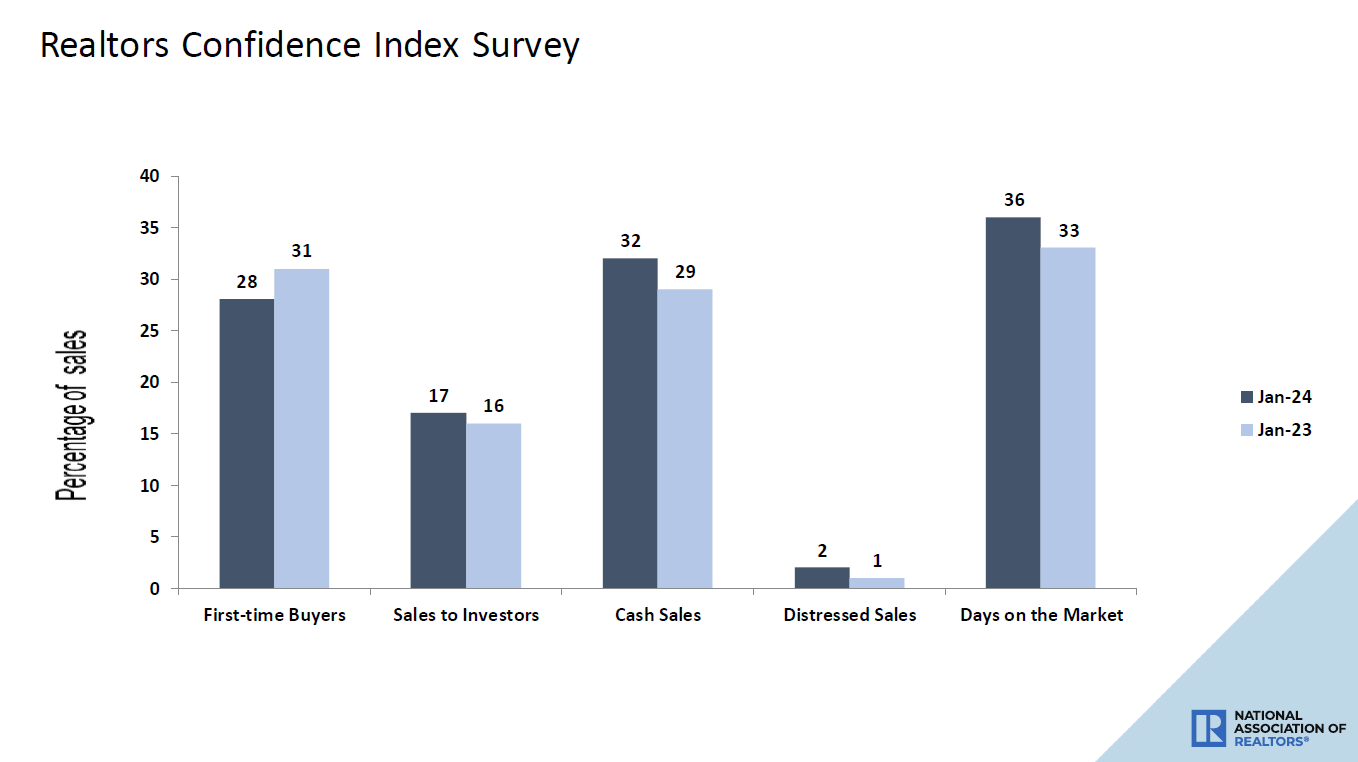
A few notes on the data above: obviously, distressed sales are not a thing and haven’t been for some time. Another positive data line is that the days on market are above 30 days, which is something I would love to see year-round. The days on market are very seasonal, but we haven’t had the days on market stay over 30 days year-round since 2020, which is a reflection of active listings still being near all-time lows.
Cash sales rising year over year looks normal as mortgage demand is lower year over year. So, as it goes with traditional January data, there are no real surprises here but a glimmer of hope that with more inventory this year, the days on market can show year-over-year growth every month.
This existing home sales report was solid, as lower mortgage rates did their thing, but looking at the current data, the last four weeks have had negative purchase application data. Purchase apps look out 30-90 days before they hit sales data. Sometimes it comes early or later in that timeframe, but after eight positive weeks of positive purchase apps, we have now had four straight negative weeks. This means 2024 is starting to look a lot like 2023 unless rates fall soon.
We don’t want to see mortgage rates break out toward 8%; even the Fed has said getting to 8% was a restrictive policy and something that isn’t in its interest. So let’s keep an eye out on that 4.34% level on the 10-year yield and hope that doesn’t break. Otherwise we could have a horrible carbon copy of what we saw in 2023.

 :215-447-7209
 : deals(at)frankbuysphilly.com
