HousingWire recently spoke with Matic CEO and co-founder Ben Madick about the changing home insurance market, how it impacts mortgage lenders and homeowners, and why lenders should pay attention.

HousingWire: What is the current home insurance market like?

Madick-Headshot-Photo-2019

Ben Madick: The home insurance market is experiencing unprecedented volatility, which has significant implications for homeowners, mortgage lenders and prospective homebuyers.

Two key trends have emerged in this landscape. Firstly, it’s more challenging to acquire insurance as home insurance carriers are imposing restrictions on new business and rapidly exiting specific markets. Secondly, the cost of home insurance is more expensive than ever as premiums are increasing at drastically high rates.

These trends stem from the challenges carriers have faced in recent years, including the surge in weather events and the rising cost of building materials. In 2022, property and casualty insurers recorded a combined ratio of 102.4% as reported by S&P Global Market Intelligence, indicating a lack of profitability.

To mitigate these losses, carriers are raising premiums for both renewal business and new business. Approval from state regulators, typically known as the Department of Insurance (DOI), is necessary for implementing rate increases. However, in certain regions such as California and New York, the DOI has been slow in approving proposed rate hikes. Carriers in California, for instance, have reported applying for home insurance rate increases as far back as six years ago, still awaiting approval. Other states impose a cap on home insurance premium increases, making it challenging for insurers to keep up with inflation.

When faced with premium delays and denials, carriers have to make a choice: either continue writing new business despite the unsustainable loss ratios or discontinue offering insurance in those specific areas. In the past year, an escalating number of national carriers have enforced limitations on new home insurance business universally. Furthermore, carriers have taken more extreme measures by completely discontinuing the underwriting of new policies in specific states. This trend, which had been a longstanding challenge in Florida, is now beginning to impact other states like California, Georgia, South Carolina, New Jersey, New York and Arizona.

In regions where rate increases are approved, carriers may continue selling new business and pass along significantly higher rates to new policyholders. For example, according to the Texas Department of Insurance, 87% of property and casualty rate change requests were approved in 2022. Consequently, home insurance premiums in Texas increased an average of 16% this year compared to 2022, bringing the average annual cost to $2,150. Back in 2020, insurance premiums averaged $1,637 in Texas.

Overall in the U.S., premiums have risen to a record high average of 9% during the first half of 2023, compared to the previous year. Rates began climbing between 5-6% in 2021 and 2022. Prior to 2021, premium increases for new business averaged between 2-4%. Additionally, for homeowners that stay with the same carrier and policy, renewal rates have experienced an even steeper incline. Across the U.S., home insurance premium renewals increased an average of 23% in the first half of 2023.

HW: Why should mortgage companies pay attention to what’s going on in home insurance?

BM: Lenders need to be aware of the insurance landscape as it can have a significant impact on their ability to efficiently close a loan due to availability and pricing. With home insurance demand surpassing supply, homebuyers are experiencing longer search times while they try to find a carrier that will accept their business. In addition to the usual research period, there are new considerations such as customer service wait times. Less than 10 home insurance carriers offer the ability to bind a home insurance policy 100% online without working with an agent in some capacity, making wait times an important factor.

For instance, when State Farm announced they were exiting California, one regional carrier in the state experienced an overwhelming 500% increase in inbound calls, causing significant delays in average wait times for existing and potential customers. These delays add complexities to the timing of when proof of insurance is required, potentially prolonging the closing process by a few days or even weeks, leading to increased costs for mortgage lenders. Rate-lock extensions alone can result in lenders losing tens of thousands of dollars per month.

In the worst-case scenario, the rising cost of insurance could lead to a mortgage being denied during the underwriting process. Accurately calculating a customer’s front-end debt-to-income ratio (DTI) requires accounting for all housing expenses, including homeowners insurance premium. It is not uncommon for loan officers to walk away from a loan or two each month when the borrower’s DTI exceeds acceptable limits once the insurance estimate is factored in.

HW: Why is working with an insurance marketplace important in this changing market?

BM: In a landscape where carriers are increasingly restricting new home insurance business, partnering with a digital insurance marketplace backed by a strong carrier network becomes essential for both borrowers and lenders.

A marketplace offers numerous benefits, such as time savings for borrowers during the research process, as multiple carriers are digitally integrated into the online shopping experience. This enables borrowers to swiftly determine the availability of options and evaluate the affordability of policies, leading to potential long-term savings and reduced DTI. Moreover, a marketplace increases the chances of borrowers finding suitable policies, particularly in areas where supply is limited.

HW: How does working with Matic help lenders improve the customer experience?

BM: We built Matic’s embedded insurance marketplace specifically for the mortgage industry to provide value to lenders, servicers and borrowers. With Matic, borrowers save time by shopping multiple carriers at once and are automatically presented with transparent pricing and coverage options. Depending on the policy, the borrower can finalize the purchase online, or they can work directly with a licensed advisor. On average, customers save over $500 a year when they purchase a policy through Matic.

Since Matic is integrated into the mortgage process, finding homeowners insurance is no longer an afterthought, which adds visibility and control for the lender, allowing them to foresee potential issues that could result in delayed closings. Additionally, it can create a passive revenue stream for mortgage companies, helping to offset down cycles.

In the early days, we invested a lot of time creating the right mix of carriers covering all 50 states so that we would be able to sustain availability limitations and rate fluctuations. Today, Matic has 45 A-rated carriers, and it continues to grow to account for the rapidly changing market.

Bottom line, Matic’s flexible insurance marketplace is essential for mortgage companies and borrowers, especially during times of unprecedented market volatility.

Learn more about Matic’s digital insurance marketplace solutions for mortgage leaders.

Note about sources/methodologies: Home insurance premiums and year-over-year changes are based on a data sampling from 6 million quoted properties analyzed from January 1, 2019, through July 10, 2023. Average Matic savings is based on Matic policyholder data from January 1, 2022, through December 31, 2022 when prior insurance premium amount is known.


Source link


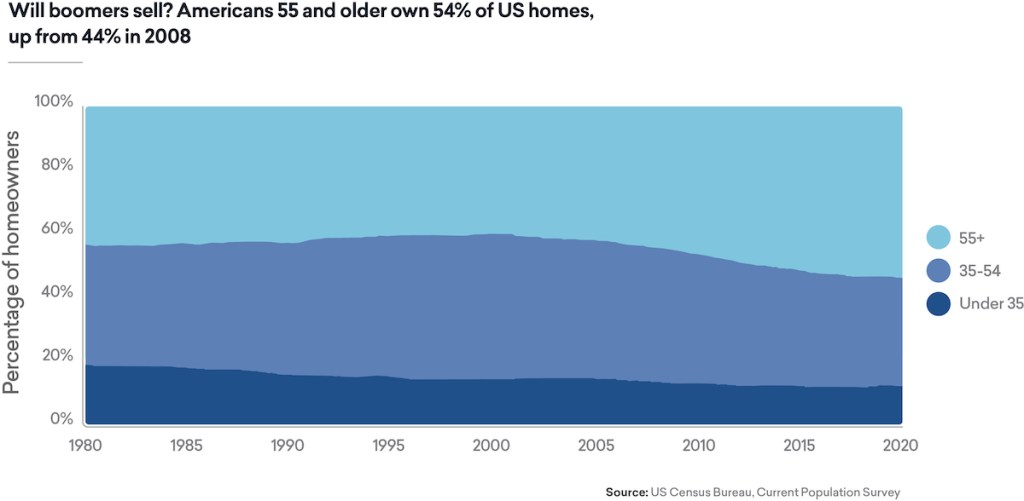
Just the term ‘baby boomer’ is sure to elicit a reaction, particularly from those in younger generations. Jealousy? Maybe because those born from 1946 to 1964 hold over half of all wealth in the U.S., and they own a comparable share of residential real estate. Contrast those trends with millennials, who hold less than 5% of the wealth in the U.S. There is also the inescapable fact that all Boomers will soon be over 60 and either retired or close to it.

Web

Boomer behaivor

This, by itself, offers hope for easing the real estate inventory crunch that continues to dampen velocity in the market, along with high interest rates. If baby boomers follow the pattern of past generations, retirement means downsizing to condos or small homes, or moving to some type of retirement community. This could put a significant number of homes, particularly single-family properties, on the market over the next decade.

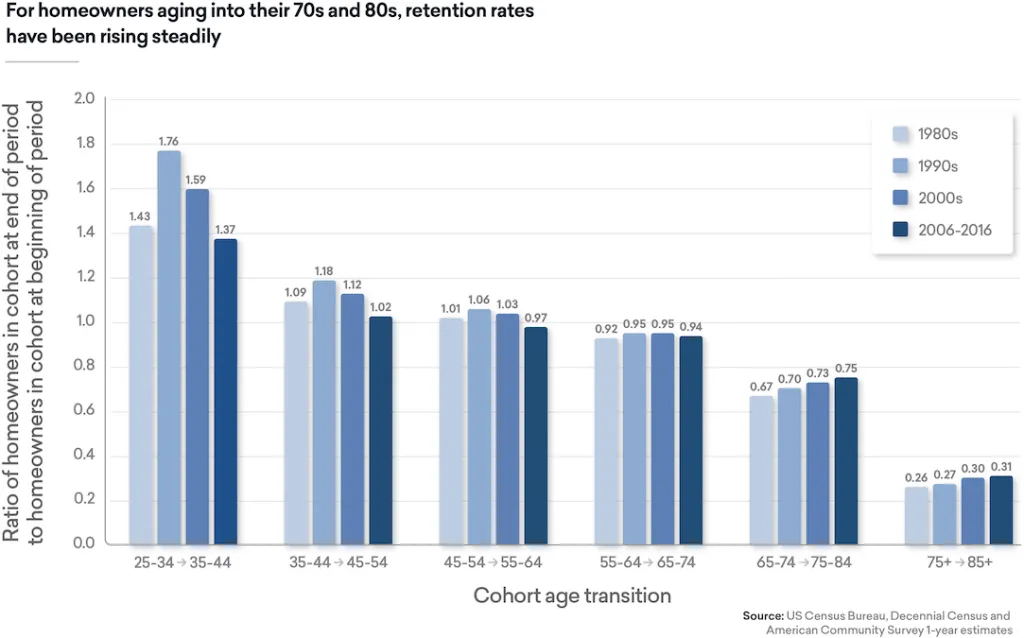
The multi-billion-dollar question, however, is: will they sell? Some data indicates that boomers will age in place longer than past generations because they have the health and wealth to do so. Census Bureau analysis, in fact, shows that the proportion of homeowners staying put after 65 and into their 70s and 80s has been increasing steadily over the past few decades. This trend is expected to continue as the last of the baby boomer generation moves into those age ranges.

Web

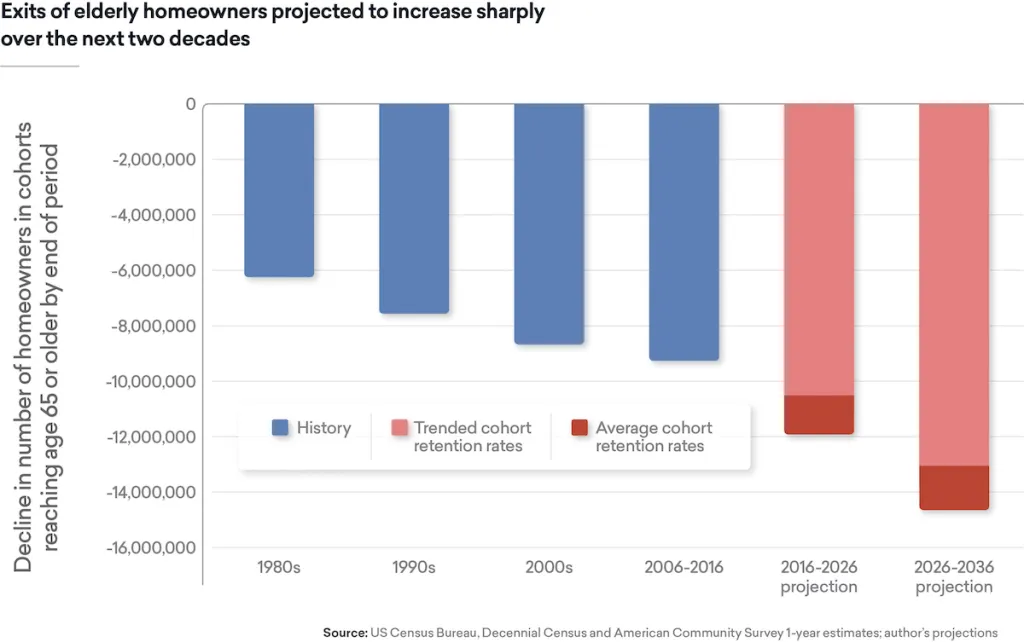
On the other hand, 2016 research by NAR showed that baby boomers comprised the largest proportion of homebuyers amongst all generations. Since this survey included purchases of all types of primary residences, this likely demonstrates that a significant number of boomers are moving out of their family residences and downsizing. A 2018 article published by FannieMae pointed out that while the proportion of boomer homeowners choosing to move out may be less than previous generations, the sheer scale of baby boomer homeownership will mean a huge increase in the number of properties that will be sold. The Census Bureau estimates that homeownership by those 65 and older in 2026 will drop by 12 million, with a further drop of 15 million in the subsequent decade. This could mean an additional 27 million properties available to the market over that period.

Generational Impact

Web

Due to their wealth and property holdings, the lifestyle choices of the baby boomer generation will continue to shape the real estate market — and the economy — for years to come. As a generation that prizes activity and independence, more of them will hang on to their homes longer than the generations before, but even with this dynamic, the large number of homeowners entering their 60s and beyond will dictate a significant increase in real estate inventory over the next decade.

Vince O’Neill is the Chief Economist for Plunk.


Source link


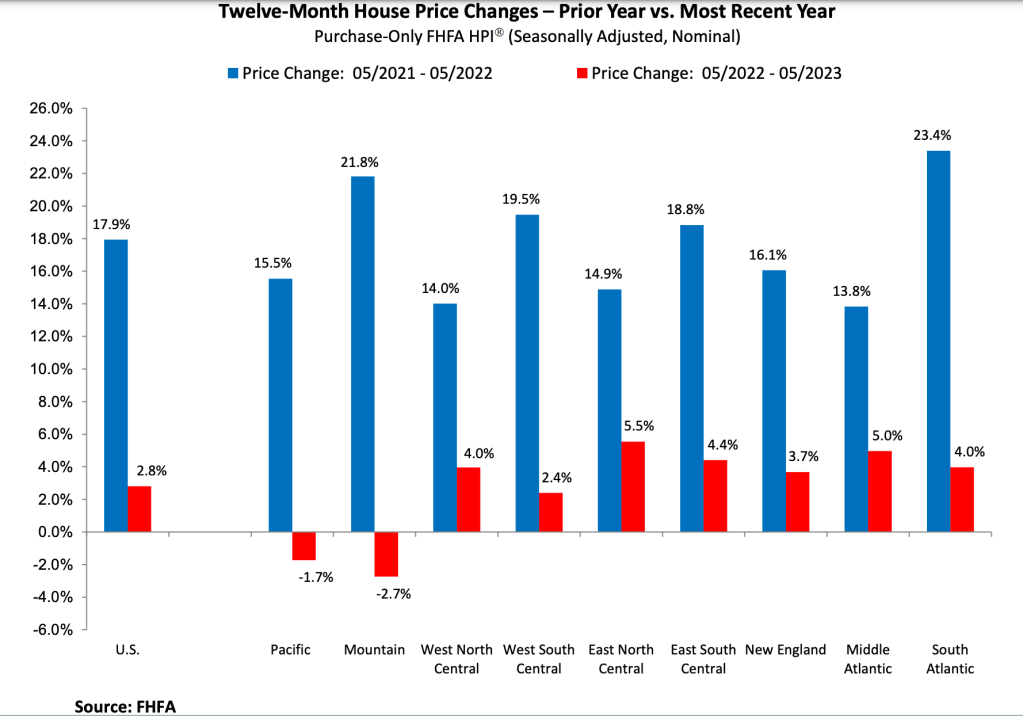
U.S. house prices rose slightly in May, up 0.7% from April, according to the Federal Housing Finance Agency (FHFA) seasonally adjusted monthly House Price Index (HPI). On a year-over-year basis, prices rose 2.8% from May 2022 to May 2023. But that only tells part of the story.

“U.S. house prices increased moderately in May, continuing the trend of the last few months,” said Nataliya Polkovnichenko, supervisory economist at the FHFA. “However, house prices in some regions of the country remained below the levels seen one year ago.”

For the nine census divisions, seasonally adjusted monthly price changes varied from April 2023 to May 2023. They ranged from -0.5% in the New England division to +1.7% in the Pacific division. The 12-month changes ranged from -2.7% in the Mountain division and -1.7% in the Pacific division, to +5% in the Mid-Atlantic division and +5.5% in the East North Central division (Illinois, Indiana, Michigan, Ohio and Wisconsin).

FHFA-HPI-data-May-2023

Also released on Tuesday, the S&P CoreLogic Case-Shiller National Home Price Index indicated that home prices rose month-over-month for the fourth consecutive time in May.

However, this decade-long rally in U.S. home prices could finally come to an end, said Robert Shiller, professor of economics at Yale University yesterday on CNBC. That is if the Federal Reserve stops its rate-hiking cycle.

“The fear of interest rate increases has influenced people’s thinking — it’s not just the homeowners, it’s new buyers who wanted to get in before the interest rates went up even more,” Shiller said on CNBC’s Squawk Box. “They wanted to lock in. So that’s been a positive influence on the market. But it’s coming to an end.” 


Source link


F2 Finance wants to scoop up a share of a “fragmented” fix-and-flip market as a lack of housing inventory sharply limits transactions.

“There’s about 8,500 fix-and-flip mortgage lenders in the U.S. just to give an idea of how fragmented it is in terms of the lender,” Christian Faes, founder of F2 Finance, said in an interview with HousingWire. America’s fix-and-flip short-term property market is estimated to be worth as much as $68 billion a year, according to F2 Finance.

“The opportunity is interesting in the sense that there’s a housing shortage. So fix-and-flip lending is directly helping that supply and demand issue in terms of creating new housing stock or upgrading what would otherwise be dilapidated housing stock,” Faes said.

F2 Finance – which launched in April –  is the first venture introduced by a fintech investment firm Faes & Co – founded by Faes in 2023. Faes & Co has also been involved with building a short-term mortgage lender in Ireland. 

Faes’ career in mortgage lending goes back to 2008 when he co-founded non-bank mortgage lender LendInvest, which was listed on the London Stock Exchange in 2021. LendInvest has more than $4.7 billion (£3.7 billion) funds under management and funding from numerous institutions, including J.P. Morgan, Citibank and Wells Fargo, according to Faes.

The Santa Monica, California-based lender is focused on short-term financing – providing fix-and-flip loans as well as bridge loans – in markets that are struggling with the lack of existing homes for sale – including California, Texas and Florida.

While more than 407,000 homes flipped in 2022, up 14% over 2021, the typical return on investment (ROI) for a fix-and-flip deal in 2022 represented the fifth decline in the past six years, according to ATTOM

Only the well-capitalized lenders are projected to survive the headwinds because it allows them to increase market share as other smaller lenders in the space pull back.

Rates for fix-and-flip loans and bridge loans are between 9% to 12% in line with where the rest of the market for those niche loans are, but it’s the speed at which borrowers can get approved for the loans is what differentiates itself from the pack, Faes noted. 

“From a borrower’s perspective, they come to us [because] they’re not having to go through an extensive X number of months of bank statements and certifying the borrower’s income. We are able to essentially lend against the asset and move very quickly,” Faes said.

F2 Finance funds its own loans and has “quite a bit of capital lined up to lend into this space” with the investors who had previously backed its UK and Irish businesses.

In the next several months, the firm plans to launch a credit fund. 

Financing periods for fix-and-flip or bridge loans typically range from a minimum of one month to a maximum of 12 months where the borrower can refinance at no penalty or costs at F2 Finance.

“If a property developer sees an opportunity where they want to sort of purchase a property this week, for example, we can provide them the cash to do that. Then maybe next month, [if] they get a more mainstream loan, they can refinance at no penalty or costs. It’s an opportunistic sort of capital for the borrower,” Faes said. 

F2 Finance declined to share the loan origination volume given the infancy stage of its business.

The lender is focused on adding more staff members from the current five to 10 by the end of 2023; expanding to other markets including Georgia, Virginia and Maryland; and connecting with referral partners to bring in production.

“We started with just a couple of introducers – groups we got to know in the market that were able to feed us deal flow (…) It’s a big market, it’s just a matter of building our profile and we can see momentum building behind the brand,” Faes said.


Source link


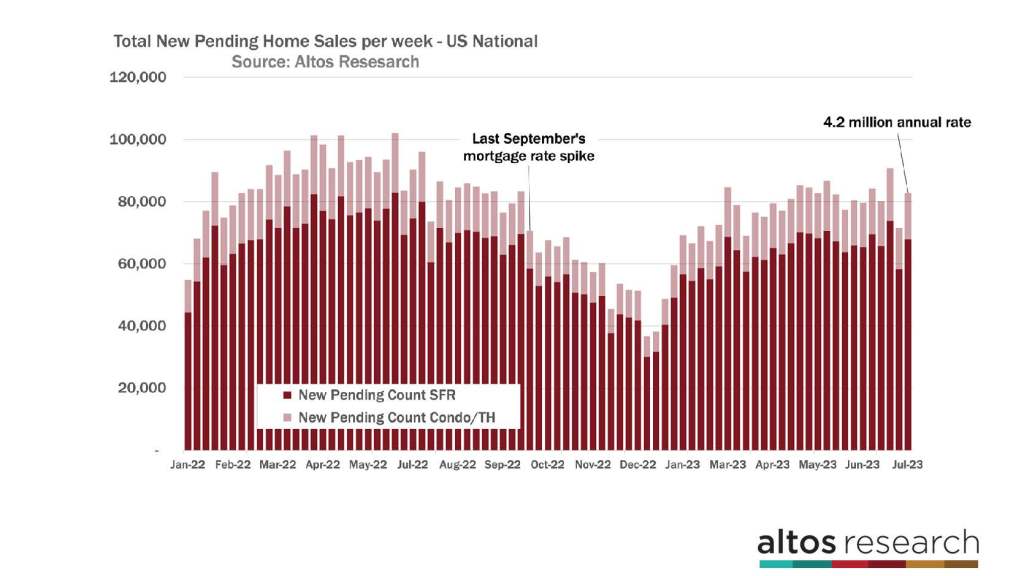
We’re going to start today looking at the pending sales. Last week the National Association of Realtors (NAR) reported that existing home sales declined in June to an annual rate of 4.2 million. It’s now obvious to everyone that home prices have held up in 2023 because demand has exceeded the very limited supply of homes to buy. The question I’ve been getting lately is whether we’ve turned the corner on home sales. The number of transactions. Will the total sales rate fall below 4 million? Will it climb closer to 5 million?

national-data-video-072423_Page_2

NAR uses a seasonal adjustment to the data, where at Altos we simply count everything. NAR reported a seasonally adjusted annual rate in June of 4.2 million home sales in June. Will that start to grow?

Pending Sales

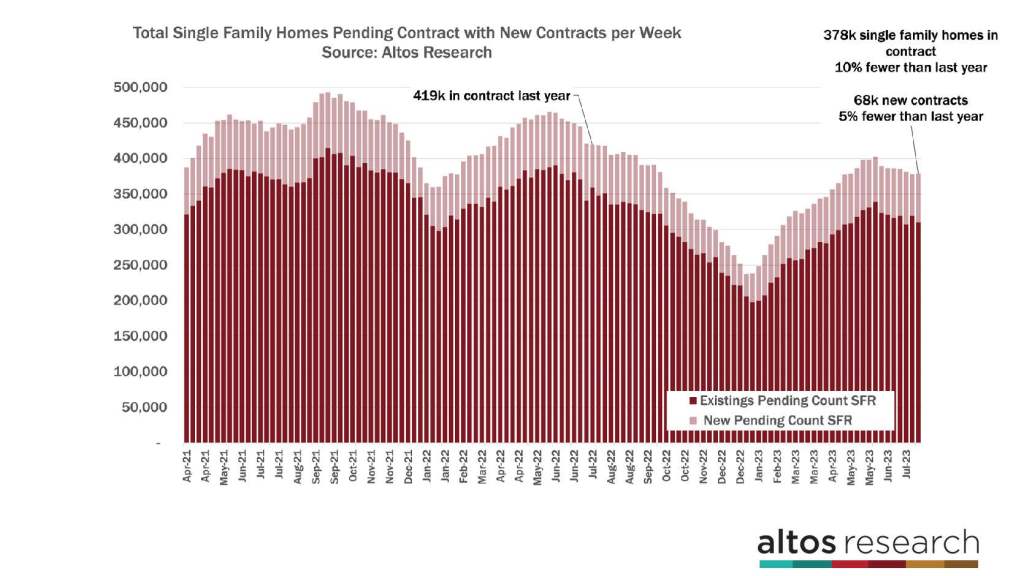
There are now 378,000 single-family homes in contract. There were 68,000 new contracts for single-family homes this week. In the chart below, the light portion of each bar represents the new contracts each week. In these videos, we focus on single-family houses and don’t include condos to keep the data clear and consistent. But, there were another 15,000 condos and townhomes that went into contract this week. The pace of 80,000 to 90,000 new sales per week translates into 4.2 million for the year. 

When you think about completed sales, the pending sales that we report here are the earliest proxy for the sales that will complete in the future. Homes typically take 30-45 days in contract. When NAR reports the June sales data, these were pending sales in April and May. So if you want to see where the sales rate will be in the future, keep your eyes on this data set. 

The pace of new sales is not accelerating. Home buying demand is limited by affordability of course, but this is a supply-constrained market. Even if demand picks up, the rate of sales is still going to be way under 5 million. The rate isn’t accelerating, but the comparison with 2022 is now getting easier.

In June, NAR reported that the existing home sales rate was 18% lower than 2022 at the same time. By our count, that margin has narrowed to 10% now. And the new sales rate — that is represented the light portion of each bar in the chart — is only 5% fewer than last year. So the pace of home sales is holding steady now, while it was falling in 2022.

national-data-video-072423_Page_3

Just to zoom in on the new sales rate. In this chart, the data shows the total count of new contracts each week. The taller the bar, the more sales are happening. The dark part of the bar represents single-family homes, and the light portion of each bar represents condos and townhomes. I included condos here so you can see the total sales pace I’m referring to. With 80,000 to 90,000 new contracts starting each week, that translates right into 4.2 million for the year. In this chart, the data also shows how rapidly the sales rate fell again in September of 2022. And how steady it has been this year. So, while the rate of sales is not really increasing, the comparison with 2022 will get easier. 2024 will likely show an increase in sales too because Q1 this year was still recovering.

national-data-video-072423_Page_4

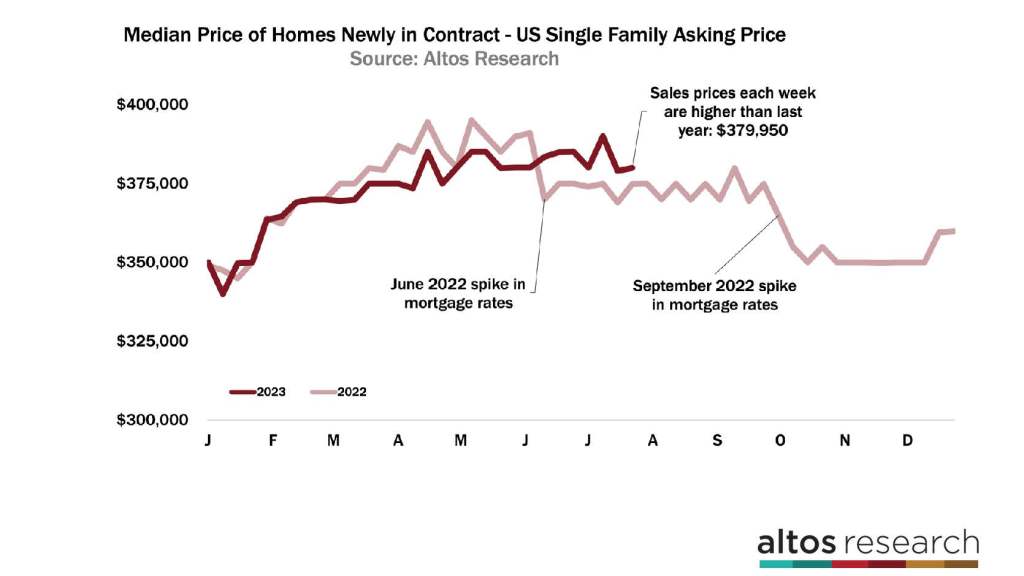
The median price of single-family homes that took offers and went into contract this week was $380,000. That’s up a tiny fraction over last week and a little over 1% higher than 2022. The trends in this chart show how quickly home buyers reacted to the big mortgage rate jumps in 2022. See the big dips in the light red line in July and September? This tells us two things: if rates jump again, consumers will react. And, by September if mortgage rates don’t jump, then the year-over-year home price changes will get much easier. You can see why home prices will likely end the year up over 2022 unless mortgage rates spike again.

I spoke with Robert Dietz the chief economist for the National Association of Home Builders (NAHB) last week on the Altos podcast, and he mentioned that they’re still of the view that last November’s peak in mortgage rates was the peak. Rates have hovered around 7% all year. The assumption that mortgage rates will come down from here is based on three things:

  1. That inflation has peaked and will continue to subside. 
  2. That the economy continues to cool or go into recession and the Fed will lower rates.
  3. The super high spreads between the 10-year bond and the 30-year mortgage will start to return back to normal levels. 

I don’t predict mortgage rates, but Dietz was very clear in his analysis, and I find that very compelling.

national-data-video-072423_Page_5

Inventory

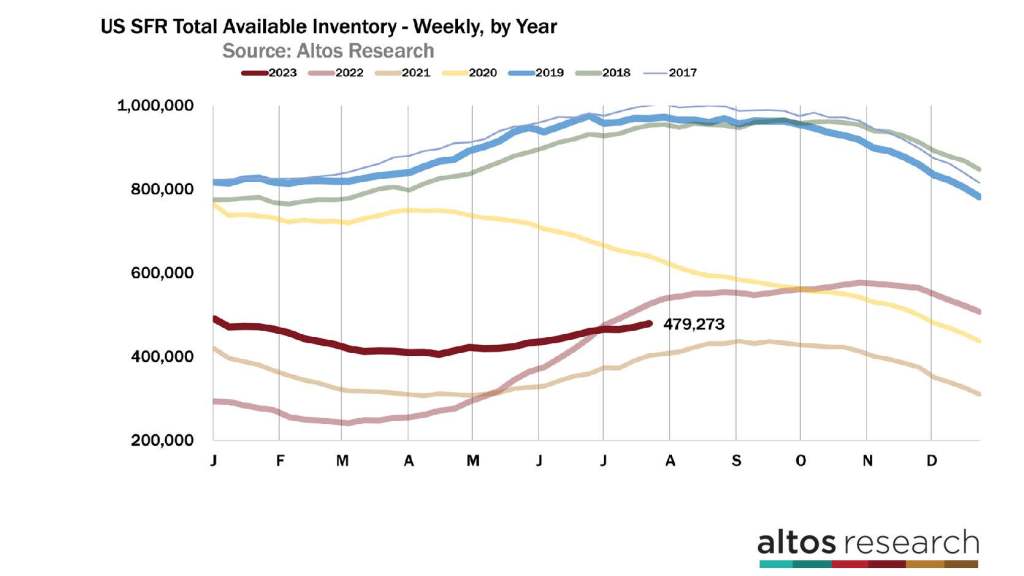
There are now 479,000 single-family homes on the market across the U.S. Each year, housing inventory typically peaks in the third quarter. If a year is a market slowdown, like 2022 or 2018, inventory might not peak until September or October. This year is not a slowdown year. Our estimation is that inventory could peak as early as next week. My guess though, is that inventory will continue to climb into late August and resemble 2021 more than say 2016. The key takeaway on inventory is that there is no signal anywhere in the data of a surge in inventory. 

We’re currently projecting to end 2023 with just over 400,000 single-family homes on the market. When we started the year, our projection was closer to 600,000. That projection changes each week when new data comes in. Each surprise lower adjusts the end of year lower. We’ve had low-inventory surprises almost every week all year.

national-data-video-072423_Page_6

Price

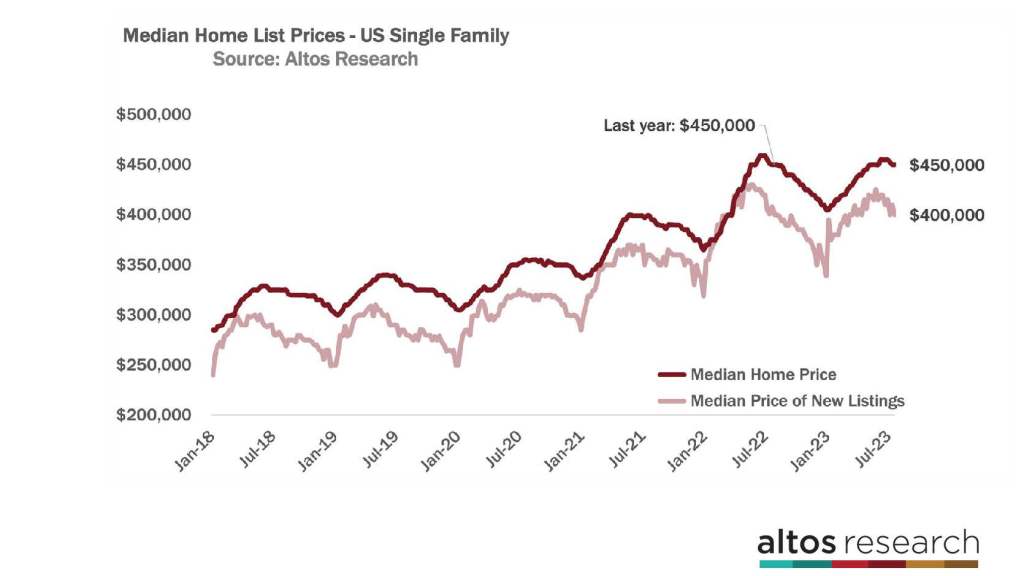
The median price of single-family homes in the U.S. is $450,000 again this week. That’s unchanged from last week and also unchanged from 2022 Last year home prices were coming down pretty quickly. In 2022, home prices peaked at a record $459,000 in early July. Home prices didn’t reach that peak again this year. $450,000 is a psychological threshold for sellers and prices tend to cluster around these big numbers. So we could see several weeks at $450,000 or $449,000 before more discounting kicks in later in the summer. Home prices should end the year at about $410,000, just a percent or two higher than the end of 2022. 

The median price of the new listings is $400,000 this week. That’s down from last week. The price of the new listings is basically unchanged from 2022. Again, this is yet another signal that despite affordability challenges for so much of the country, there are sufficient buyers at these prices and these mortgage rates that home prices are not falling in 2023.

national-data-video-072423_Page_7

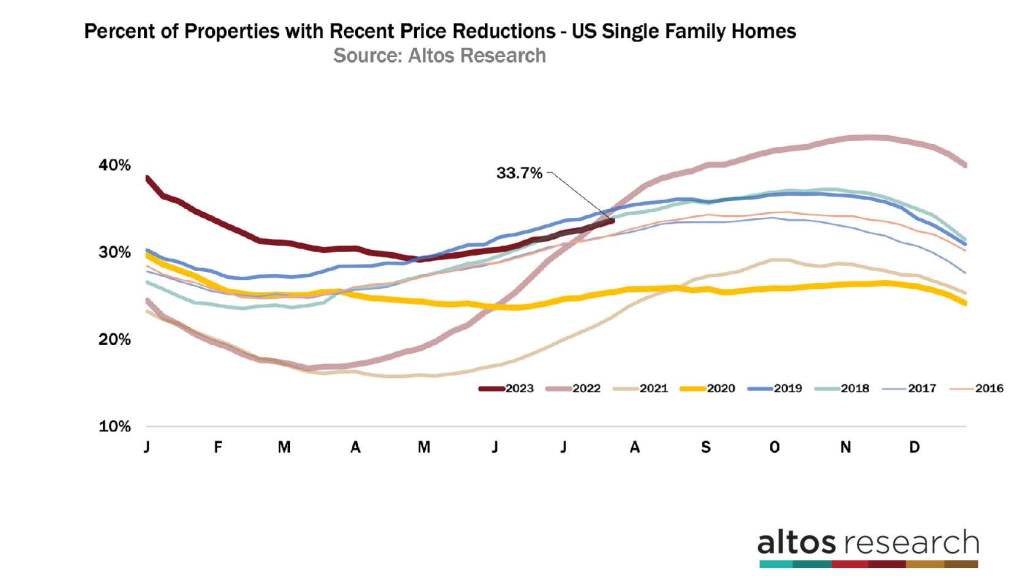
The percentage of homes with price reductions increased to 33.7%. That’s a third of the homes on the market that have taken a price cut from their original list price. Each line on this chart represents a year. You can see the annual curves that the market goes through and how it illustrates when the demand is highest, the price reductions are the lowest. I included a few more years here to illustrate how solidly in “normal” territory the market is. Balanced between buyers and sellers. The slope of the curve, how steeply it’s rising or falling, tells us if the market is shifting. 2023 is represented by the dark red line. The light red line represents 2022, and the yellow line represents 2020. Those two years are the most striking. You can see how dramatically the market changed in those years. But If you study the data closely, you’ll notice that in 2017 and 2019, the market accelerated in the second half of the year. In 2018 it decelerated. Those were much more subtle shifts but if you were selling a house in the fall of 2018, you felt it for sure.

The trend in price reductions right now is just on the slow side of balanced. We can see fractionally more price cuts when mortgage rates are near 7% than when they’re closer to 6%. Slightly fewer offers, which means slightly more price cuts for the homes on the market. 

The balance in this data implies that the sales prices in August, September and October will hold up just fine. Again, buyers are mortgage rate sensitive, so if rates spike, we’ll watch the rate of price cuts increase too. You can see the jump in the light red line in September of 2022. Hopefully, Dr. Dietz is correct and rates have seen their highest watermark. 


Source link


CoreLogic is strengthening its Wildfire Mitigation Score data (WFMS). The firm announced Friday that it is incorporating Public Resource Code (PRC) 4291 inspection data into its WFMS. According to CoreLogic, it is the first firm to incorporate this data.

CoreLogic said it plans on using this data to improve its prefill solution by providing insurance carriers with important wildfire mitigation information to support policyholders.

The mitigation factors in PRC 4291 are mandated by the California Department of Insurance Section 2644.9.

According to CoreLogic, by incorporating this data it is streamlining the identification process for carriers and policyholders, as well as promoting awareness and preventative measures homeowners can take to protect their homes against wildfires.

CoreLogic’s WFMS ranges from 0.1 to 100 and it enables insurance and reinsurance firms to consider the 12 mandatory mitigation factors mandated by the CDI and assists insurers in assessing wildfire risk.

Typically, insurers obtain proof that a property has passed inspection from the policyholder. With this integration, however, insurers will have access to information about a property’s CDI compliance, allowing them to gain property-specific insights.

Started in 2016, the inspection database is maintained by the California Department of Forestry and Fire Protection (CAL FIRE). Homeowners and business owners are able to request a CAL FIRE inspection on their property at any time. In some areas, an inspection may be required for the property to be sold. CAL FIRE is the insurer of last resort in California, with insurance companies saying that increased wildfire risk and skyrocketing construction costs have deterred them from writing new policies.

In late May, insurance giant State Farm announced that it would no longer accept homeowner insurance applications in California. The policy impacts anyone seeking a new business and personal lines property and casualty insurance policy in California. Another large insurer, All State, said in November that it would pause new homeowners, condo and commercial insurance policies in California to protect current customers.

“The cost to insure new home customers in California is far higher than the price they would pay for policies due to wildfires, higher costs for repairing homes and higher reinsurance premiums,” Allstate said in a statement.


Source link


For most states, the pipeline for construction of single-family homes specifically designed as rentals is booming. However, not all states are jumping on the trend. Market conditions in 10 states are such that this kind of construction isn’t a priority. In fact, these states are seeing no additional construction of single-family homes for rent, according to reporting at Axios.

On a per-capita basis, Arizona is the state with the most built-for-rent housing in the construction pipeline with 2,011 units planned or under construction per one million inhabitants, according to data from the National Rental Home Council (NRHC). Coming in at a “distant second” is North Carolina with 1,071; while Texas is in third place with 856. The nationwide average sits at 345.

No single family rental construction in 10 states

However, despite data from Zillow that illustrates that to meet the housing supply needs of the nation, the United States needs 4.3 million more homes, there are 10 states that aren’t constructing built-for-rent housing, the reporting explains. Among them are Oregon, Massachusetts and West Virginia, where there is no built-to-rent construction of single-family homes “ongoing or planned at all,” based on NRHC data.

Why are these states lagging, some of the reticence likely has to do with a lack of favorable market conditions for construction, according to David Howard, NRHC’s CEO.

“Portland and, more broadly, the state of Oregon have many of the kind of drivers that housing developers are looking for when they enter a market,” Howard told Axios. But that enthusiasm could be diminished in a state like Oregon due to its limits on annual rent increases.

Banning rent increases in Oregon

Last month, the state banned rent increases higher than 10% in years of high inflation, and the law went into effect on July 6. The bill was drafted in response to complaints from the state’s renters, as some areas saw increases of as much as 14.7% in 2022.

“The debate highlighted the high rate of rental ownership in the state Capitol, where passive income from owning property makes it possible for lawmakers to afford to be in Salem for months each year on their $35,000 legislative salary,” according to reporting at the Oregon Capital Chronicle. “Portland Rep. Thuy Tran, [also a] landlord, was one of only two Democrats who voted against the measure.”

Measures such as rental increase bans put builders on edge, Howard explained to Axios.

“Say what you will about the legitimacy of various rent control and rent cap regimes […] it’s something that causes developers to pause in their consideration of whether they want to enter a market,” he said. “I think developers have gravitated toward other markets where there perhaps is more certainty.”


Source link


Delmar Mortgage has become the latest lender to partner with Freddie Mac on a special purchase credit program that aims to narrow the housing gap for historically underserved communities.

As part of Freddie Mac’s BorrowSmart Access program, first-time homebuyers residing in specific metropolitan markets can access up to $3,000 in down payment and closing cost assistance, subject to eligibility criteria and area median income requirements.

“We are thrilled to introduce this program, aiming to narrow the gap in homeownership for our valued clients. While it is already accessible in multiple markets, we are particularly excited to bring this opportunity to our communities, where we have proudly served for over 57 years,” said Kelly Hendrick, senior vice president at Delmar Mortgage.

The Freddie Mac BorrowSmart Access program is available in the following metropolitan markets:

  • Atlanta-Sandy Springs-Alpharetta, Georgia
  • Chicago-Naperville-Elgin, Illinois-Indiana-Wisconsin
  • Detroit-Warren-Dearborn, Michigan
  • El Paso, Texas
  • Houston-The Woodlands-Sugar Land, Texas
  • McAllen-Edinburg-Mission, Texas
  • Memphis, Tennessee-Mississippi-Arkansas
  • Miami-Fort Lauderdale-Pompano Beach, Florida
  • Philadelphia-Camden-Wilmington, Pennsylvania-New Jersey-Delaware-Maryland
  • St. Louis, Missouri-Illinois

To qualify for the program, aspiring homebuyers must meet specific residency criteria within one of these metropolitan areas. Eligibility for the $3,000 assistance will also be based on the area median income and other qualifying factors.

The program is part of Freddie Mac’s equitable housing finance plan, which it updated in March with additional financing for accessory dwelling units (ADUs) and manufactured housing units as well as multifamily initiatives.

Delmar Mortgage was founded in 1966 and operates in 38 states with 16 branch locations.

Other lenders offering the program include Rocket MortgageCrossCountry Mortgage, and Guild Mortgage.

This content was generated using AI and was edited by HousingWire’s editors.


Source link


Rithm Capital Corp., the real estate investment trust that operates NewRezCaliber and several other businesses, entered into a definitive agreement to acquire Sculptor Capital Management Inc. for $639 million, the company announced on Monday. 

The deal, if approved by regulators, will bring to Rithm Sculptor’s $34 billion of assets under management, including real estate, credit and multi-strategy investing spectrum. To Sculptor, Rithm will provide capital to accelerate growth across sectors and seed new funds and strategies. 

Rithm is paying $11.15 per Class A share of Sculptor – a premium of 18% over the closing price on July 21 – with cash on hand and available liquidity. The transaction is expected to be neutral to Rithm earnings in 2024 and accretive in 2025. 

In the first quarter of 2023, Rithm had a GAAP net income of $68.9 million, compared to $81.8 million in the previous quarter. The company had $1.4 billion in cash. Rithm is scheduled to release second-quarter earnings on August 2. 

Michael Nierenberg, chairman, CEO and president of Rithm Capital, said in a statement that the transaction is “transformational.”

“Sculptor’s $34 billion of AUM coupled with Rithm’s $7bn of permanent equity capital and $30+ billion balance sheet creates a world-class asset management business,” Nierenberg said. 

Sculptor will operate as a subsidiary of Rithm, led by Jimmy Levin as CIO and executive managing partner, who will report to Nierenberg. Sculptors’ investment and leadership teams will continue in their roles. 

“We have long sought a partner with the stable capital structure, culture and vision to help unlock the potential for our platform to deliver more and greater value to our fund investors,” Levin said in a statement. 

Sculptor formed on November 17 a special committee of independent directors to explore potential transactions. Sculptor’s leadership has agreed to vote their shares, representing about 26% of the outstanding voting shares, in favor of the transaction. The board of directors of Rithm and Sculptor have approved the deal.

The transaction, subject to customary closing conditions, is expected to close in the fourth quarter of 2023.

The deal with Sculptor comes four days after Rithm’s acquisition of $1.4 billion worth of unsecured personal loans from Goldman Sachs‘ Marcus business unit. Rithm bought the portfolio at a discount, Nierenberg told Bloomberg

“This purchase is extremely attractive to us building off our past and current expertise in consumer finance,” Nierenberg said in a statement.

In another potential transaction, Rithm said in May that it was considering spinning off the mortgage division to aid its flagging stock, which company executives described as “extremely undervalued.”


Source link


Although filling out IRS tax forms each year isn’t any fun, it is a necessary part of real estate investing. Thankfully, the tax forms for rental properties aren’t complicated. If you are investing as a member of a partnership or as an S corporation, you will need to report your earnings on Form 8825.

Making sure you fill out Form 8825 correctly is vitally important. Accurate financial reporting is required and could help you determine if you qualify for certain tax deductions.

What Is Form 8825?

IRS Form 8825 is a special tax form specifically for reporting the rental income and expenses of a partnership or S corporation. The form allows you to record the financial information for eight different properties. If you have more than eight, the additional properties can be reported on a second Form 8825.

Form 8825 is not to be used by sole proprietors or single-member LLCs. If you are filing as a sole proprietor or single-member LLC, you will record your rental real estate activities on Schedule E (Form 1040), which is used to report supplemental rental real estate income and expenses.

Who Uses Form 8825?

Form 8825 reports the rental income of partnerships or S corporations in the United States. Suppose your S corporation owns two apartment buildings, a self-storage facility, and three single-family rental homes. In that case, you will need to include the income and expenses of each property on the form.

If you are reporting partnership income, Form 8825 should be attached to Form 1065 (U.S. Return of Partnership Income). If you report S corporation income, Form 8825 should be attached to Form 1120S (U.S. Income Tax Return for an S Corporation).

It’s important to point out that Form 8825 can be used if your partnership is an LLC, but it doesn’t have to be used for all LLCs. A single-member LLC, for example, would use Schedule E (Form 1040).

What Type of Expenses Go On Form 8825?

The IRS only taxes rental real estate activity on the net income earned. Net income simply refers to gross income less expenses. To derive the taxable net income, Form 8825 includes lines to enter certain expenses, which include:

  • Advertising
  • Auto and travel
  • Cleaning and maintenance
  • Commissions
  • Insurance
  • Legal and other professional fees
  • Interest
  • Repairs
  • Taxes
  • Utilities
  • Wages and salaries
  • Depreciation
  • Other

If you aren’t sure whether a particular operating expense qualifies, check the Internal Revenue Service website. You can also consult a tax professional like a CPA to clarify the issue.

How Do You Fill Out Form 8825?

Although IRS form 8825 may appear somewhat intimidating when you first look at it, it’s not complicated. The form is logical and easy to follow. The required information for each line is clearly labeled, and the instructions are included when you download the form.

  1. Enter your name and employer identification number (EIN). It’s important to ensure you include this information on all the tax forms you submit. This will help to prevent errors or delays if a form is lost or misplaced.
  2. List the physical address of each property you own. You must also include the property type (multi-family, single-family, short-term rental, etc.). You will also need to indicate the number of days the property was rented and the number of days it was used for personal use (if any).
  3. Enter the gross income for each property. Be sure to match the right income to the right property. For example, the income you list in column A must match the property you listed in row A.
  4. Enter all of your expenses for each property. If you have any expenses not listed, you can include them in the section labeled “Other.” Add all of your expenses for each property to determine the total. You then subtract the total expenses from the gross income for each property to determine the income or loss.
  5. Add your gross rental income (line 2, columns A-H) and gross rental expenses (line 16, columns A-H).
  6. Enter the net gain or loss from the sale of rental real estate property. This information is found on Form 4797, Part II, line 17.
  7. Enter your net income or loss from any rental real estate activity that is from a partnership, estate, or trust where the S corporation or partnership is a beneficiary or partner. This information is obtained from Schedule K-1.
  8. Enter the names and EIN of the partnerships, estates, or trusts from the previous step.
  9. Determine your net rental real estate income or loss. This is done by adding everything in steps 5-7. You will then enter the amount either on Form 1065 (for partnerships) or Form 1120S (for S corporations).

What Does a Practical Example Look Like?

The best way to understand how to fill out Form 8825 is with a practical example. Let’s say you are in a real estate partnership that owns the following properties:

  • One multi-family property
  • Three single-family homes
  • Two self-storage facilities

Because you are in a partnership and your rental real estate activities are not from a sole proprietor or single-member LLC, you must complete Form 8825 to report your rental real estate income.

After filling out the name and EIN number on Form 8825, you will enter each property’s physical address and the number of days it was used as a rental in rows A-H. Be sure to list each of the single-family homes and self-storage facilities separately.

You will then enter your gross rental income and expenses for each property in columns A-H to obtain your net gain or loss. Next, enter the income or loss from Schedule K-1 on line 20a. Enter the name of each partner and the EIN, and then combine lines 18a-20a. You will then enter the result on either Form 1065 (for partnerships) or Form 1120S (for S corporations).

That’s all there is to it. Although many tax forms have earned reputations for being difficult and time-consuming, Form 8825 is simple and easy.

How Do You List LLCs on Form 8825?

Many real estate investment partnerships form limited liability companies (LLCs) to protect their personal assets in case they are sued. If someone slips and falls in a rental unit, the owner’s bank accounts, homes, and other personal assets are protected if the suit is successful. LLCs can be either single-member (one owner) or multi-member.

Because Form 8825 is only for partnerships or S corporations, you will only list LLCs on the form that are either partnerships or S corporations for tax purposes. If you have a single-member LLC, rental income will be reported on Schedule E (Form 1040).

Is Form 8825 the Same as Schedule E?

Form 8825 and Schedule E (Form 1040) are similar insofar as they are used to report rental real estate income. They are, however, two separate and distinct forms.

The primary difference between the two forms is that Form 8825 is used if you declare on behalf of a partnership or S-corporation. On the other hand, Schedule E is used to report an individual owner’s earnings. Schedule E is also used to report other forms of supplemental income.

The process for reporting rental real estate income and expenses on Schedule E is similar to Form 8825. You must include the physical address of each property and its type and the number of days it was used as a rental. You will then enter your gross rental income and itemize your expenses to determine your profit or loss for each property.

What Is Schedule K-1?

Schedule K-1 is a form you will need to fill out to obtain important information included on Form 8825. The form determines the net income or loss from rental real estate activities from partnerships, estates, and trusts. Instead of reporting the full income or loss, Schedule K-1 determines each partner’s share.

Let’s assume a partnership has four members and earns $200,000 annually. Each partner will complete a Schedule K-1 to report $50,000 in individual earnings (assuming the profit is split evenly). This amount is then transferred to line 20a of Form 8825.

The Bottom Line

If you are a sole proprietor or a single-member LLC, you don’t have to worry about Form 8825. If your rental real estate activities are part of a partnership or your business is an S corporation for tax purposes, however, you must include the form when submitting your income taxes.

Thankfully, Form 8825 isn’t complicated or difficult to understand. It can be filled out in just a few minutes, which allows you to finish your taxes and get back to doing what you do best—closing more deals and growing your portfolio.

Dreading tax season?

Not sure how to maximize deductions for your real estate business? In The Book on Tax Strategies for the Savvy Real Estate Investor, CPAs Amanda Han and Matthew MacFarland share the practical information you need to not only do your taxes this year—but to also prepare an ongoing strategy that will make your next tax season that much easier.

Note By BiggerPockets: These are opinions written by the author and do not necessarily represent the opinions of BiggerPockets.


Source link