Issuance of agency mortgage-backed securities (MBS) is projected to contract significantly over the next two years in the face of a housing-market contraction, but the actual supply of MBS available for purchase in the private market is expected to swell to record levels over that period.
That’s the takeaway from a recent market report by the Amherst Group, a real estate investment firm based in Austin, Texas. The major contributor to the projected elevated MBS supply, according to the report, is the Federal Reserve and its monetary-tightening policy.
Part of the Fed’s strategy to beat back inflation includes raising the benchmark interest rate, which is now in the 4.5% to 4.75% range, up from 0.25% a year ago. That interest-rate tool is coupled with another lever known as tapering, which involves the Fed orchestrating a major retreat from the agency MBS market by allowing assets to run off its $2.6 trillion MBS portfolio as the securities mature or prepay.
That tapering, for now, is being accomplished by not replacing those MBS assets — with the Fed’s run-off cap set at $35 billion per month.
“When I look out over the next six months, 12 months, 18 months, I do see this big overhang of [MBS] supply that needs to be absorbed on the agency side, and spreads definitely need to be wider,” which likely translates into upward rate pressure for the mortgage market, explained Sandeep Bordia, head of research and analytics for the Amherst Group.
Bordia added that the pace of Fed MBS run-off, including prepayments slowed by a lack of refinancing, is now “only around $15 billion to $20 billion [per month].”
“So, they [the Fed] would really need to get into selling MBS actively to reach that $35 billion cap, though they have suggested that they are not inclined to do that.”
The Amherst report forecasts that the net issuance of MBS, which includes Fannie Mae, Freddie Mac and Ginnie Mae securities, is projected at $325 billion in 2023 and $375 billion for 2024. That reflects a substantial reduction in new and existing-home sales and refinancing.
By comparison, agency net MBS issuance in 2021, when interest rates were half of what they are today, came in at $870 billion. Net issuance represents new securities issued less the decline in outstanding securities due to principal paydowns or prepayments.
In 2021, however, the Federal Reserve was a major purchaser of MBS, to the tune of $475 billion, according to the Amherst report. Last year, net agency MBS issuance dropped to $530 billion.
In 2022, the Fed began employing its tapering tool in stages, a strategy that expanded the effective MBS supply in the market by some $80 billion last year, Amherst reports.
“There’s been a broader rise in interest rates but, in addition, the MBS market had the rug pulled out from under it [last year] by losing the main buyer with the Fed,” said Sean Banerjee, co-founder and CEO of ORSNN, a Seattle-based fintech that operates a cloud-based trading platform.
Over the next two years, the Fed’s monetary tightening policies are projected by Amherst to add a total of at least $450 billion in new MBS supply based on its existing run-off strategy. So, even though agency net MBS issuance is projected to decline from $530 billion in 2022 to $325 billion this year and $375 billion in 2024, the added MBS supply created by the Fed’s quantitative tightening will effectively increase the overall supply of MBS that needs to be absorbed by the private market, compared with even the banner year of 2021.
The agency MBS market is immense and expanding, with some $8.1 trillion in outstanding debt at the end of 2021, a figure that jumped to an estimated $8.6 trillion last year, the Amherst report shows. By yearend 2023, according to the report, the size of the agency MBS market is projected to jump to $8.9 trillion and to nearly $9.3 trillion by the close of 2024. By comparison, in 2013, outstanding MBS debt stood at about $5.4 trillion.
Agency MBS trading activity also “dwarfs the other segments of the market, with $288 billion of daily trading volume,” according to a recent report from the Federal Reserve Bank of New York. That compares to daily trading volume of $2.7 billion for commercial mortgage-backed securities (CMBS) and only $500 million for nonagency residential MBS.
“The effective supply the private market sees is organic net issuance plus Fed runoff/sales,” the Amherst report states. “The amount of supply that the market needs to absorb over the next couple of years is close to all-time highs, likely around $1.2 trillion.”
The report adds that because of the high interest-rate environment, which reduces mortgage prepayments via refinancing, the Fed is not likely to reach its monthly $35 billion run-off cap any time soon. The Fed’s monthly run-off pace is estimated at about $20 billion currently, or about $225 billion annually.
If the central bank decides to actively sell MBS to make up the difference, the Amherst report estimates that the effective supply of MBS created by such a move would increase to $420 billion a year over the next two years — or roughly $840 billion. That’s in addition to projected agency net issuance over the two-year period of about $700 billion.
MBS sales?
Mortgage data-analytics firm Recursion, which specializes in the MBS market, reports that the bulk of the Federal Reserve’s MBS portfolio is backed by mortgage collateral that is well-below prevailing market rates, which further complicates the scenario in which the Fed might start actively selling its MBS assets.
“Outright sales of 2% and 2.5% coupons will likely impact the market quite differently from a situation in which a low-coupon mortgage is extinguished” via a run-off strategy, Recursion states in its market-analysis blog. “As outright sales have not been used up to this point, it seems clear that caution needs to be employed when considering such an action.”
In a press conference this past fall, Fed Chair Jerome Powell said MBS sales were not “under consideration ‘anytime soon’, making run-off our base case,” the Amherst report concludes.
Regardless of the approach, the net effect of the increased MBS supply due to the Fed’s monetary-tightening policy is to put continued upward pressure on interest rates. Spreads are projected to widen by another 10 basis points through June of this year and another 17 basis points through June of next year, according to the Amherst analysis.
So, as the mortgage market weakens as projected, driven by a Federal Reserve policy, MBS coupon rates for new issuance are expected to rise due to the perceived risk to the underlying collateral (mortgages) as well as the increased MBS supply relative to demand. At the same time, the coupon rates for benchmark Treasury bonds are expected to face downward pressure as investor demand rises for secure investments like U.S. government-backed notes — further widening spreads.
Those widening spreads, in turn, put upward pressure on primary mortgage rates, given home loans are the collateral behind MBS.
“If the Fed was to sell MBS, we would expect spreads to widen 20 basis points through June 2023 in OAS [option-adjusted spread] terms,” the report states. “We would expect a further 27 basis-points widening through June 2024.”
That’s the bad news for prospective homebuyers and lenders. The good news for investors is that there will be plenty of attractively priced MBS available to purchase over the next few years as supply expands.
Who will buy these assets? The Amherst report indicates that it’s not likely to be banks, who are coping with falling reserves and were net sellers of MBS in 2022 — around $200 billion in total. The volume of MBS assets that can be retained by Fannie and Freddie is now capped, effective the end of 2022, at $225 billion each, so Amherst expects their MBS holdings to remain flat.
Likewise, the report says foreign-currency hedging issues are likely to keep many overseas investors on the sidelines with respect to MBS market. In addition, a number of real estate investment trusts (REITs) are struggling with lower capital positions now “and absent meaningful equity raises, should have limited capacity for further addition” of MBS assets.
“We buy agency securities to hedge our MSR [mortgage-servicing rights] portfolio and, without a doubt, agency spreads are wider than they have been historically,” said Nick Smith, founder and CEO of Minneapolis-based private-equity firm Rice Park Capital. “…And there’s still subdued demand from the traditional buyers of MBS.
“Traditionally, banks have been a huge buyer of agency MBS, and there’s some structural reasons why they just aren’t buying as much. One of them is they have big portfolios and the prepayment speeds have slowed down so much [due to a drop-off in mortgage refinancing) that they just don’t have a lot of organic cash-flow that has been created to reinvest in the agency market.”
The big buyer going forward, though, according to Bordia and Amherst’s report, is expected be money managers, also known as portfolio or investment managers. Examples of leading money managers include Pacific Investment Management Co. (PIMCO), Vanguard Group Inc., Fidelity Investments Money Management, Blackrock Fund Advisors, J.P. Morgan Asset Management as well as individual money managers like Warren Buffett of Berkshire Hathaway.
“We believe that most of this elevated [MBS] supply is going to be absorbed by money managers, and given how bearish and sensitive they are, it is likely that spreads remain somewhat on the wider side to the extent that they have to absorb the significant amount of supply.” Amherst’s Bordia said. “…But there is a lot of money waiting on the sidelines.”
Bordia added that 2022 was a challenging year for the mortgage market, marked by a “lot of surprises on the inflation front and coming from the Fed.”
“I would like to think that there would be fewer surprises this year but, again, I think given where we are, it’s really, really hard to make that call,” he stressed. “So, if I were to be put on the spot, I would say I think [2023] is going to be similarly interesting like last year.”
Source link


 :215-447-7209
 : deals(at)frankbuysphilly.com
How non-QM lender A&D Mortgage grew origination volume in 2022
When the entire mortgage industry saw volume drop by more than half in 2022, nearly every lender emerged with battle scars. Rising rates caused refinances to dry up, production plummeted, and pink slips were issued to employees.
Non-qualified mortgage (non-QM) wholesale lender A&D Mortgage, however, saw origination volume increase by more than 31% to $3.2 billion in 2022, up from the previous year’s $2.2 billion, largely due to improvement in tech that helped pick up market share from competitors, Max Slyusarchuk, CEO of A&D Mortgage, said in an interview with HousingWire.
“We continue investing in tech while it’s not that crazy busy. We are doing a lot of research and development in it and artificial intelligence,” Slyusarchuk said. “We believe that this is the time of opportunity because the rates can go up, but sooner or later, they will start coming down.”
The lender shifted from using third-party mortgage tech company software systems to developing its proprietary loan origination software, servicing software, pricing engine and customer relationship management system last year, Slyusarchuk said.
A&D is also in the final stages of its non-QM automated underwriting system, which will be distributed to broker partners in the coming months.
Last year was not easy for non-QMs as the Federal Reserve tightened its monetary policy. As rates rose, prepayment speed dropped, which, in turn, led to the extension of the life of the bond.
While investor bonds were scarce, A&D securitized its loans and sold the bonds, leading to seven securitization deals in 2022. The lender securitized four deals in 2021.
“Our credit committee actually works with rating agencies, investors and investment bankers to put together our own guidelines. We have our unique guidelines with our unique product,” Slyusarchuk said.
Out of $3.2 billion in origination volume in 2022, about $2.8 billion came from non-QMs last year – double the $1.3 billion non-QM origination volume for the Florida-based lender in 2021.
Despite higher origination volume, the company slashed 10% of its employees at the end of 2022 following a 30% increase in headcount the year prior.
It was A&D’s servicing portfolio that helped feed the business during the tough times in 2022, Slyusarchuk said.
The lender began servicing some investor loans in 2008, adding non-QM loans in 2015 and expanding to Fannie Mae loan servicing in 2017. It added Freddie Mac loans in 2019 and jumbo loans for JPMorgan Chase the following year.
In an effort to bring in more volume in 2023, the wholesale lender improved eligibility on all its non-QM programs early last month.
“We decreased the FICOs on certain products, increased loan-to-value (LTV) ratios on certain products, allowed some different income types, and allowed some mixed income types,” Slyusarchuk said.
Effective March 1, A&D is also giving brokers a 0.25 lender credit on non-QM purchase loans in the West Coast — namely Arizona, California, Oregon, Nevada and Washington. Valid until March 15, the broker will receive the lender credit of 0.25 bps toward closing costs at the time of the closing.
“We believe that non-QM should not suffer a loss in value as much as conventional because there are many alternative ways to qualify,” Slyusarchuk said. “We’re picking up some of the guys from conforming loans.”
In 2022, about 50% of its sales came from existing homeowners, 40% from investors and 10% from first-time buyers, according to A&D Mortgage. Bank statement and debt-service coverage ratio (DSCR) loans are its bread and butter, accounting for 40% and 30% of the total volume respectively last year.
“About one out of 10 guys say I still want to buy. Some buyers don’t qualify with their tax returns but with their bank statements, or asset depletion, they do qualify,” Slyusarchuk said. “So a [self-employed] borrower would get the loan now, because his wife really liked the house and would refinance later.”
Source link
Agency MBS market is facing a supply-side threat
Issuance of agency mortgage-backed securities (MBS) is projected to contract significantly over the next two years in the face of a housing-market contraction, but the actual supply of MBS available for purchase in the private market is expected to swell to record levels over that period.
That’s the takeaway from a recent market report by the Amherst Group, a real estate investment firm based in Austin, Texas. The major contributor to the projected elevated MBS supply, according to the report, is the Federal Reserve and its monetary-tightening policy.
Part of the Fed’s strategy to beat back inflation includes raising the benchmark interest rate, which is now in the 4.5% to 4.75% range, up from 0.25% a year ago. That interest-rate tool is coupled with another lever known as tapering, which involves the Fed orchestrating a major retreat from the agency MBS market by allowing assets to run off its $2.6 trillion MBS portfolio as the securities mature or prepay.
That tapering, for now, is being accomplished by not replacing those MBS assets — with the Fed’s run-off cap set at $35 billion per month.
“When I look out over the next six months, 12 months, 18 months, I do see this big overhang of [MBS] supply that needs to be absorbed on the agency side, and spreads definitely need to be wider,” which likely translates into upward rate pressure for the mortgage market, explained Sandeep Bordia, head of research and analytics for the Amherst Group.
Bordia added that the pace of Fed MBS run-off, including prepayments slowed by a lack of refinancing, is now “only around $15 billion to $20 billion [per month].”
“So, they [the Fed] would really need to get into selling MBS actively to reach that $35 billion cap, though they have suggested that they are not inclined to do that.”
The Amherst report forecasts that the net issuance of MBS, which includes Fannie Mae, Freddie Mac and Ginnie Mae securities, is projected at $325 billion in 2023 and $375 billion for 2024. That reflects a substantial reduction in new and existing-home sales and refinancing.
By comparison, agency net MBS issuance in 2021, when interest rates were half of what they are today, came in at $870 billion. Net issuance represents new securities issued less the decline in outstanding securities due to principal paydowns or prepayments.
In 2021, however, the Federal Reserve was a major purchaser of MBS, to the tune of $475 billion, according to the Amherst report. Last year, net agency MBS issuance dropped to $530 billion.
In 2022, the Fed began employing its tapering tool in stages, a strategy that expanded the effective MBS supply in the market by some $80 billion last year, Amherst reports.
“There’s been a broader rise in interest rates but, in addition, the MBS market had the rug pulled out from under it [last year] by losing the main buyer with the Fed,” said Sean Banerjee, co-founder and CEO of ORSNN, a Seattle-based fintech that operates a cloud-based trading platform.
Over the next two years, the Fed’s monetary tightening policies are projected by Amherst to add a total of at least $450 billion in new MBS supply based on its existing run-off strategy. So, even though agency net MBS issuance is projected to decline from $530 billion in 2022 to $325 billion this year and $375 billion in 2024, the added MBS supply created by the Fed’s quantitative tightening will effectively increase the overall supply of MBS that needs to be absorbed by the private market, compared with even the banner year of 2021.
The agency MBS market is immense and expanding, with some $8.1 trillion in outstanding debt at the end of 2021, a figure that jumped to an estimated $8.6 trillion last year, the Amherst report shows. By yearend 2023, according to the report, the size of the agency MBS market is projected to jump to $8.9 trillion and to nearly $9.3 trillion by the close of 2024. By comparison, in 2013, outstanding MBS debt stood at about $5.4 trillion.
Agency MBS trading activity also “dwarfs the other segments of the market, with $288 billion of daily trading volume,” according to a recent report from the Federal Reserve Bank of New York. That compares to daily trading volume of $2.7 billion for commercial mortgage-backed securities (CMBS) and only $500 million for nonagency residential MBS.
“The effective supply the private market sees is organic net issuance plus Fed runoff/sales,” the Amherst report states. “The amount of supply that the market needs to absorb over the next couple of years is close to all-time highs, likely around $1.2 trillion.”
The report adds that because of the high interest-rate environment, which reduces mortgage prepayments via refinancing, the Fed is not likely to reach its monthly $35 billion run-off cap any time soon. The Fed’s monthly run-off pace is estimated at about $20 billion currently, or about $225 billion annually.
If the central bank decides to actively sell MBS to make up the difference, the Amherst report estimates that the effective supply of MBS created by such a move would increase to $420 billion a year over the next two years — or roughly $840 billion. That’s in addition to projected agency net issuance over the two-year period of about $700 billion.
MBS sales?
Mortgage data-analytics firm Recursion, which specializes in the MBS market, reports that the bulk of the Federal Reserve’s MBS portfolio is backed by mortgage collateral that is well-below prevailing market rates, which further complicates the scenario in which the Fed might start actively selling its MBS assets.
“Outright sales of 2% and 2.5% coupons will likely impact the market quite differently from a situation in which a low-coupon mortgage is extinguished” via a run-off strategy, Recursion states in its market-analysis blog. “As outright sales have not been used up to this point, it seems clear that caution needs to be employed when considering such an action.”
In a press conference this past fall, Fed Chair Jerome Powell said MBS sales were not “under consideration ‘anytime soon’, making run-off our base case,” the Amherst report concludes.
Regardless of the approach, the net effect of the increased MBS supply due to the Fed’s monetary-tightening policy is to put continued upward pressure on interest rates. Spreads are projected to widen by another 10 basis points through June of this year and another 17 basis points through June of next year, according to the Amherst analysis.
So, as the mortgage market weakens as projected, driven by a Federal Reserve policy, MBS coupon rates for new issuance are expected to rise due to the perceived risk to the underlying collateral (mortgages) as well as the increased MBS supply relative to demand. At the same time, the coupon rates for benchmark Treasury bonds are expected to face downward pressure as investor demand rises for secure investments like U.S. government-backed notes — further widening spreads.
Those widening spreads, in turn, put upward pressure on primary mortgage rates, given home loans are the collateral behind MBS.
“If the Fed was to sell MBS, we would expect spreads to widen 20 basis points through June 2023 in OAS [option-adjusted spread] terms,” the report states. “We would expect a further 27 basis-points widening through June 2024.”
That’s the bad news for prospective homebuyers and lenders. The good news for investors is that there will be plenty of attractively priced MBS available to purchase over the next few years as supply expands.
Who will buy these assets? The Amherst report indicates that it’s not likely to be banks, who are coping with falling reserves and were net sellers of MBS in 2022 — around $200 billion in total. The volume of MBS assets that can be retained by Fannie and Freddie is now capped, effective the end of 2022, at $225 billion each, so Amherst expects their MBS holdings to remain flat.
Likewise, the report says foreign-currency hedging issues are likely to keep many overseas investors on the sidelines with respect to MBS market. In addition, a number of real estate investment trusts (REITs) are struggling with lower capital positions now “and absent meaningful equity raises, should have limited capacity for further addition” of MBS assets.
“We buy agency securities to hedge our MSR [mortgage-servicing rights] portfolio and, without a doubt, agency spreads are wider than they have been historically,” said Nick Smith, founder and CEO of Minneapolis-based private-equity firm Rice Park Capital. “…And there’s still subdued demand from the traditional buyers of MBS.
“Traditionally, banks have been a huge buyer of agency MBS, and there’s some structural reasons why they just aren’t buying as much. One of them is they have big portfolios and the prepayment speeds have slowed down so much [due to a drop-off in mortgage refinancing) that they just don’t have a lot of organic cash-flow that has been created to reinvest in the agency market.”
The big buyer going forward, though, according to Bordia and Amherst’s report, is expected be money managers, also known as portfolio or investment managers. Examples of leading money managers include Pacific Investment Management Co. (PIMCO), Vanguard Group Inc., Fidelity Investments Money Management, Blackrock Fund Advisors, J.P. Morgan Asset Management as well as individual money managers like Warren Buffett of Berkshire Hathaway.
“We believe that most of this elevated [MBS] supply is going to be absorbed by money managers, and given how bearish and sensitive they are, it is likely that spreads remain somewhat on the wider side to the extent that they have to absorb the significant amount of supply.” Amherst’s Bordia said. “…But there is a lot of money waiting on the sidelines.”
Bordia added that 2022 was a challenging year for the mortgage market, marked by a “lot of surprises on the inflation front and coming from the Fed.”
“I would like to think that there would be fewer surprises this year but, again, I think given where we are, it’s really, really hard to make that call,” he stressed. “So, if I were to be put on the spot, I would say I think [2023] is going to be similarly interesting like last year.”
Source link
Announcing the 2023 Tech100 Real Estate Winners
For more than a decade, the HW Tech100 program has identified and recognized the most innovative technology companies serving the mortgage and real estate industries.
The 2023 Tech100 Real Estate winners are changing the home sales process forever – from home search to lead management solutions, and remote closing to transaction management software. These companies are leading the way toward a more innovative and efficient housing market and bringing to market solutions that we could have only imagined a decade ago.
The table below shows the 2023 winners. These are the companies and solutions helping real estate professionals propel their businesses forward in 2023.
Congratulations the 2023 Tech100 Real Estate honorees.
Source link
Announcing the 2023 Tech100 Mortgage Winners
For more than a decade, HousingWire’s Tech100 program has identified and recognized the most innovative technology companies serving the mortgage and real estate industries.
The 2023 Tech100 Mortgage winners are continuing to bring innovation to the mortgage process – from origination to closing, and servicing to secondary markets. Their groundbreaking technologies and visionary ideas are transforming the way we buy, sell and finance homes.
The following table shows the 2023 winners. These are the companies and solutions helping mortgage professionals capture market share, retain borrowers and improve margins in an ever-changing housing market.
Congratulations to the 2023 Tech100 Mortgage honorees.
Source link
Higher mortgage rates dim hope for a busy spring housing market
Higher mortgage rates have zapped mortgage demand, as buyers are having second thoughts about purchasing homes.
Mortgage applications for home purchases dropped 6% for the week ending February 24 from the previous week, according to the Mortgage Bankers Association’s seasonally adjusted index. Mortgage demand was also 44% lower than the same week a year ago, and is now sitting at a 28-year low.
“After a brief revival in application activity in January, when mortgage rates dropped down to 6.2%, there has now been three straight weeks of declines in applications, as mortgage rates have jumped 50 basis points over the past month,” said Joel Kan, MBA’s vice president and deputy chief economist.
Data on inflation, employment and economic activity signaled that inflation may not be cooling as quickly as anticipated, putting upward pressure on rates, Kan explained.
The average contract interest rate for 30-year fixed-rate mortgages with conforming loan balances that are $726,200 or less increased to 6.71% from the previous week’s 6.62%. The average contract interest rate for 30-year fixed-rate mortgages with jumbo loan balances that are greater than $726,200 remained at 6.44% during the same period.
At HousingWire‘s Rate Center, the Optimal Blue data showed rates at 6.681% on Tuesday, up from last week’s 6.638%. At Mortgage Daily News, rates were even higher at 6.85%.
Some buyers who recently applied for a mortgage may hold off on purchasing until rates cool off again, Logan Mohtashami said in a recent column.
“I call this rate lock risk, where some buyers don’t qualify or don’t want to continue the purchase until rates fall again. Rates spiking almost 1% in mere weeks is damaging because it can take some previous buyers out of play,” Mohtashami said.
Mortgage loan originators had hoped for a heated spring housing market, as rates were declining in January, but hopes are dimming.
“It’s almost like there was a false start,” Dan Monson, branch manager at Sente Mortgage said.
“Maybe a month ago, somebody turned on the spigot. All of a sudden there were leads, referrals and action. But recently, somebody turned it back off. I don’t know that there’s a rush coming,” Monson said.
Demand to refinance also declined for the week, dropping by 6% week over week, and refi demand was 74% lower compared to the same week last year.
“Refinance applications account for less than a third of all applications and remained more than 70% behind last year’s pace, as a majority of homeowners are already locked into lower rates,” Kan said.
The refinance share of mortgage activity decreased to 31.8% of total applications from 32.5% in the previous week. The USDA share of total volume also declined to 0.5% from 0.6% during the same period.
The adjustable-rate mortgage (ARM) share of activity rose to 8.1% of the total volume. The FHA share of total applications remained unchanged at 12.1%.
However, it’s not all doom and gloom. There are hopes for more activity toward the latter half of the year.
The MBA expects the 30-year fixed-rate mortgage to drop to 6.1% in the second quarter, 5.7% in the third quarter and 5.3% in the fourth quarter.
“The year is starting off slowly, but I think we’re going to finish in a pre-pandemic number,” Monson said. “Last year [production] was front-end loaded [and] this year is going to be back-end loaded.”
Source link
Why it’s time for the housing industry to get serious about climate risk
For decades, the housing industry has viewed climate risk as a fairly straightforward issue.
You build the home to code. You use the right comps to appraise it. You check the 100-year floodplain determination box during origination. Job’s done – the rest can be handled by the property and casualty folks.
Recently; however, that perspective has begun to fade as the frequency and severity of these ‘once-in-a-lifetime’ events has continued to increase, each one causing more damage than the last.
And yes, this certainly has had an impact on insurance companies from coast to coast, as we’ve seen insurers retreat en masse from states such as California, Florida, and Texas, which have all seen record losses in recent years from wildfires, earthquakes, hurricanes, severe winter storms, sinkholes, and more. However, the ramifications of climate risk are now being felt throughout the broader industry, especially as a larger and larger percentage of this damage comes in the form of uninsured losses.
These losses – both insured and uninsured – have traditionally been borne by homeowners, renters, landlords, builders, and property & casualty insurance companies.
Change in uninsured losses
As of late, however, the uninsured losses are being absorbed by other stakeholders in the housing finance system, including mortgage lenders, mortgage servicers, private mortgage insurers, government agencies, capital markets investors, and the government-sponsored enterprises.
And this has not gone unnoticed by federal regulators who seem increasingly concerned for the risks that uninsured climate-related losses pose to our nation’s broader financial system. The Federal Housing Finance Agency (FHFA) issued a request for information in January 2021 focused on Climate and Natural Disaster Risk Management at Fannie Mae, Freddie Mac, and the Federal Home Loan Banks. Both the Securities and Exchange Commission (SEC) and General Services Administration (GSA) are looking to amend disclosure law to better account for climate risk among public companies and the federal contractor supply chain, respectively. And the Federal Reserve has asked the nation’s six largest banks to participate in a climate scenario analysis designed to measure and manage climate-related financial risks.
It’s time to get serious about climate risk
It is time for the housing industry to get serious about the importance of climate risk, which has pushed its way to the forefront among the most critical issues facing our housing system today. Thankfully, recent technological innovations in climate science and analytics allow us to quantify the true impact of climate risk, and it goes well beyond the 100-year floodplain designation to which we’ve grown accustomed.
If you’re reading this, you are probably already aware that CoreLogic has long been the industry standard for 100-year floodplain risk, covering everything from flood determinations to underwriting risk to catastrophic flood risk assessments for insurers, capital markets, and more. We know firsthand that flooding is the most common natural disaster that our nation faces, accounting for roughly 75% of all presidential disaster declarations in the United States. Floodplain determinations are the cornerstone of hazard risk assessments in this country, and they will continue to play a large role for years to come.
However, as the frequency and severity of natural hazards continues to increase, there is so much more that needs to be considered. The impacts of climate change are introducing additional layers of risk to the mortgage industry, and we need to think seriously about how we plan to identify, quantify, and mitigate that risk.
Climate Risk Analytics
To this end, CoreLogic recently launched Climate Risk AnalyticsTM, which offers a comprehensive view of physical risk that combines hyperlocal property data with financial information to estimate and mitigate the impact and cost of future catastrophes. This solution – built on Google Cloud’s secure and sustainable infrastructure – is designed to help companies, government agencies, and enterprises measure, model, and mitigate the physical risks of climate change to the housing industry, from the present through 2050.
Climate Risk Analytics can help banks to quantitatively articulate their overall physical risks while also fulfilling their regulatory obligations to present key stress test results to agencies like the Federal Reserve.
Allows mortgage bankers to prioritize post-disaster mortgage servicing
In practice, Climate Risk Analytics will help mortgage bankers prioritize certain aspects of their post-disaster mortgage servicing process (e.g., property inspections) allowing them to restart their origination pipelines much sooner and continue to close loans without delay. It will provide underwriters with a more holistic view of all the property information, natural hazard risk assessments, and loan documentation that they will need to understand the true risks to a specific property.
Mortgage servicers who are obligated to advance principal, interest, taxes, and insurance (PITI) payments on the loans they hold will be able to better identify specific loans that may become delinquent or be at a higher risk of default as a result of a natural hazard and prioritize them in response efforts. Secondary markets investors can use this solution to aggregate and analyze physical risk at a portfolio level, helping to guide future investment strategies. And federal regulators can better address climate-related financial issues facing low-to-moderate (LMI) communities and communities of color.
In short, CoreLogic Climate Risk Analytics is designed to provide the housing industry with an end-to-end, complete collateral solution for assessing climate-related physical risk.
As Congress, the federal government, and the housing industry continue to question the true extent of natural hazard risk – and how we insure it – there is a growing need for new insights and tools that can identify and address the complex challenges associated with climate change. By combining existing risk management techniques with innovative climate risk modeling, we can build a stronger, safer, and more resilient housing market. One that minimizes uninsured losses, optimizes the use of taxpayer funds, and better protects homeowners from future disasters.
This article was written by Jay Kingsley, president, Mortgage Solutions for CoreLogic; Pete Carroll, executive and head of public policy for CoreLogic; and Russell McIntyre, senior policy analyst for CoreLogic.
Source link
What It Is And How Avoid It
Did you know you may be charged a prepayment penalty for attempting to pay off your loans early?
Prepayment penalties are fees that some lenders charge if you refinance or pay your mortgage off early. Not only are they fairly common—they’re also often misunderstood by borrowers.
In this article, we’ll discuss how a mortgage prepayment penalty works, the types of prepayment penalties you may encounter, and how to avoid paying them.
How Prepayment Penalties Work and Why Lenders Charge Them
Your monthly mortgage payment consists of principal and interest payments. Principal payments pay down your loan, while the interest payments go to your lender. When you take a loan, your lender expects to make money on those interest payments. Lenders include prepayment penalties in mortgage contracts to make you think twice before prematurely refinancing or paying off your loan.
Let’s say you take out a 30-year fixed $250,000 at 5% interest. If you don’t increase or make extra mortgage payments, at the end of 30 years, the total cost of your loan is $483,165. $250,000 for the principal and $233,165 in interest.
However, if you suddenly come into money and decide to pay your loan off after two full years, your lender will only receive $22,619.43 in total interest payments. If you instead pay off half of your loan balance, that will significantly reduce how much interest you’ll owe and cut into your lender’s profits.
Thankfully, prepayment penalties are becoming less common. Also, your mortgage lender is required to inform you if they are included in your closing paperwork. If your lender doesn’t, they can’t charge for them if you refinance your loan or pay it off early.
Are There Limits on Prepayment Penalties?
The Dodd-Frank Act imposed limits on prepayment penalties to safeguard property owners from sticker shock. Lenders can only charge a mortgage prepayment penalty during the first three years of your loan’s term. The most they can charge is 2% of your loan’s balance during the first two years of your loan and 1% during the third year.
If you are charged a mortgage prepayment penalty during this period, you pay a lump sum fee when you sell or refinance your home.
Also, federal law prohibits lenders from charging prepayment penalties if you have an FHA loan, a USDA loan, or a VA loan. Student loans are also exempt from these fees.
Examples of Prepayment Penalties
Let’s say you take a 30-year mortgage loan out on a property for $300,000 with a 5% fixed interest rate. A little after a year, your house skyrockets to a new market value of $350,000, so you decide to sell it even though your lender informed you of your contract’s prepayment penalty clause.
At this point, you still owe $295,000. Since you’re selling within the first two years of ownership, your lender charges you a 2% prepayment penalty of $5,900 ($295,000 x 2%). If you wait until your third year, the penalty drops to 1%, or $2,950. After accounting for closing fees and the real estate agent’s cut, is it worth taking in the home another year or two to reduce or eliminate your prepayment penalty? That all depends on your circumstances.
Let’s say you decide to refinance your loan to 4% instead. At 5%, you’ll pay $279,767 in total interest over 30 years. At 4%, you’d pay $215,609 in total interest, a difference of more than $64,000 (excluding interest you’ve already paid to your current lender). It also shaves about $180 off of your monthly mortgage payment.
If your prepayment penalty is the same as the first example ($5,900), you can make money for the fees back in about 33 months ($5,900 / $180). If the rates will remain at 4%, it’s likely more worth waiting a year or two—but not always. Rates can fluctuate constantly, so deciding whether you should refinance depends on how much you’ll save in the long term.
Types of Prepayment Penalties
There are two common types of prepayment penalties you may encounter:
How to Avoid Prepayment Penalties
Luckily, avoiding prepayment penalties isn’t too difficult. Here’s how:
You can also make extra payments occasionally without getting charged a prepayment penalty. Usually, these payments only appear on your lenders’ radar when you make a substantial payment (i.e., 20% of your principal or more).
Are Paying Prepayment Penalties Worth It?
The answer can be yes or no and is decided on a case-by-case basis. Check with your lender to see if your contract has a prepayment penalty clause. Sometimes it’s worth it to keep making regular payments until the clause expires or to invest your money elsewhere.
Find a Lender in Minutes
A great deal doesn’t just sit around. Quickly find a lender who specializes in investor-friendly loans that are right for you and your investment strategy.
Note By BiggerPockets: These are opinions written by the author and do not necessarily represent the opinions of BiggerPockets.
Source link
Black Knight reports slimmer organic growth in 2022
Mortgage technology giant Black Knight reported slimmer organic growth in 2022 amid operational challenges for its clients, which stemmed from high interest rates.
Black Knight reported organic revenue growth of 4%, which demonstrates the durability of our business model,” the firm’s chief executive officer Joe Nackashi said in a statement. “We remain focused on winning new clients, expanding and extending our relationships with existing clients through cross-sales and contract renewals, and delivering innovative new solutions.”
Organic growth in 2022 declined from the previous year’s 10%, which is in line with the mortgage analytics data company’s expectations. Kirk Larsen, Black Knight’s CFO had projected organic growth would likely fall between 7% and 8% in 2022.
“High interest rates following the rapid rise since early 2022 caused operational challenges for our clients and prospects. Market conditions have also resulted in elevated originator consolidation, bankruptcies and associated attrition,” the company’s 8-K filing said.
Black Knights’ 2022 net earnings of $452.5 million were more than double the previous year’s $207.9 million, and the firm’s investment in credit report services company Dun & Bradstreet Holdings, Inc. (DNB) resulted in an increase in net earnings of $306.7 million, the tech company said.
Profits in the last quarter of 2022 totaled $52.8 million, however — a decline of 36% compared to the same quarter of 2021.
Revenue reached $383.5 million from October to December, a decrease of 1% from the same period in 2021. The company’s margin declined to 13.8% from 21.5% during the same period.
Black Knight’s software solutions posted revenue of $331 million in Q4, an increase of 1% from 12 months ago.
Of the software solutions segment, the origination software solutions revenue declined 2% in the fourth quarter from the same period in 2021 — driven primarily by new clients that were more than offset by the effect of lower origination volumes and attrition, Black Knight said in its 8-K filings.
Servicing software solutions revenue rose 2% during the same period, which was led by “revenues from new clients and cross-sales to existing clients, an increase in foreclosure-related revenues and contract termination fees, partially offset by headwinds from lower transactional revenues,” filings showed.
Revenue of its data and analytics sector declined 8% to $52.4 million in Q4 2022 from Q4 2021.
The firm attributed the decline in data analytics to new sales that were more than offset by attrition, the effect of lower origination volumes, and lower revenues related to a reduction in scope for two strategic data deal renewals in Q4 2021.
In total, Black Knight posted revenue of $1.55 billion in 2022, an increase of 5% from the previous year. Operating margin declined to 17.9% compared to the previous year’s 20.5%.
Software solutions represented 86% of the revenues last year, with an operating margin of 44.2%, compared to 46.6% in 2021. The remaining revenue came from data and analytics, a segment with an operating margin of 24.5%, down from 28.7% in the same period last year.
Ahead of the potential merger with rival Intercontinental Exchange Inc., Black Knight didn’t provide forward-looking guidance and didn’t host a conference call related to its financial results.
The company’s filings with the Securities and Exchange Commission (SEC) provided more detail into the potential transaction.
ICE-Black Knight deal
“Regulatory approvals may not be received, may take longer than expected or may impose conditions that are not presently anticipated, that could have an adverse effect on ICE following the merger or that are otherwise unacceptable to ICE,” according to the company’s 10-K filings.
“The merger agreement is subject to a number of conditions that must be satisfied or waived in order to complete the merger,” the filing showed.
If the merger agreement is terminated under certain circumstances, Black Knight may be required to pay a termination fee of $398 million to ICE, according to the filing with the SEC.
ICE announced plans to acquire Black Knight in a $13.1 billion deal in May 2022, with a goal to complete the acquisition in the first half of 2023.
The deal, however, faces headwinds amid antitrust concerns from trade groups and some U.S. lawmakers. Opponents of the deal claimed consumers could face higher costs due to the pricing power ICE would gain in the mortgage data market and may discourage new market players.
The U.S. Federal Trade Commission (FTC), which has been scrutinizing the Black Knight deal for months, is expected to challenge the ICE deal, Politico reported, citing three people with direct knowledge of the matter.
A case is expected to be filed in March, and no decision would be final until then, according to the outlet.
Both Black Knight and ICE declined to comment on the news report.
Investment bank Keefe, Bruyette & Woods (KBW) expects ICE to continue to pursue the merger and litigate, and anticipates that the deal has more than a 50% probability of closing.
“We expect resolution is more likely by the end of 2023, assuming a lawsuit is filed in March,” KBW’s note said.
Source link
Housing Market Tracker: Higher rates crush purchase apps
We created the weekly Housing Market Tracker because housing data has been so wild since 2020. The housing market madness persisted last week as inventory fell and higher mortgage rates took a bigger bite out of purchase application data.
Here is a quick rundown from last week:
Purchase application data
There is no way around this story; we had a solid streak from Nov. 9, 2022 to February of this year, when the purchase application data was trending positively as mortgage rates fell from 7.37% to 5.99%. Then rates went up almost 1% over several weeks, completely reversing the gains.
The 12 weeks of positive purchase application data are now in the system, and people who applied for a loan are looking and buying. How does the sharp increase in rates directly impact those homebuyers? Some who recently applied for a mortgage were looking to buy as rates fell, but now they may hold off purchasing until rates cool off again.
I call this rate lock risk, where some buyers don’t qualify or don’t want to continue the purchase until rates fall again. Rates spiking almost 1% in mere weeks is damaging because it can take some previous buyers out of play.
On top of that, the forward-looking purchase apps have been impacted negatively. As seen in the index below, we have returned to levels last seen in 1995.
The last two weeks in purchase apps look out 30-90 days. Some homebuyers have bought a home, which will show up in the upcoming sales data, as we saw a positive number in today’s pending home sales report. However, with the negative purchase application data, we have lost the continuous positive streak that started on Nov. 9.
Last week on CNBC I said I wasn’t surprised that new home sales data did better than anticipated, and we should see better existing home sales data in the next report. However, the positive trend story changed in the last two weeks, and it’s hard to get more stability when rates move up and down this much.
So, now we will have to track the sales data more closely to see whether some buyers didn’t end up pulling the trigger and if they come back later in the year if rates fall back to 6%.
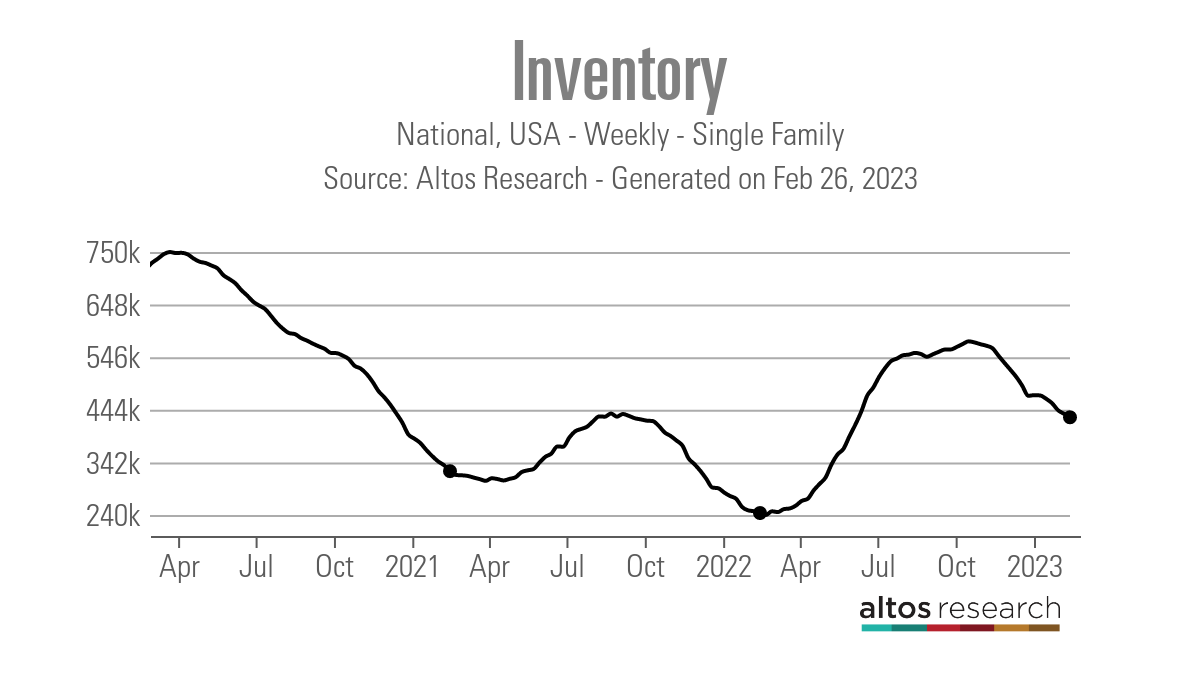
Weekly housing inventory
Traditionally, weekly housing inventory bottoms in January and we see a regular rise in the spring and summer, then a fade in the fall and winter. Post-2020, inventory has been bottoming out later in the year, and I have a working theory on this. We have had three abnormal events in housing since 2020 that have all happened toward the end of the year, which has moved the timeline for the seasonal bottom in housing inventory.
Continuing with that theme, inventory has fallen again this week by 6,801, but we should be getting closer to the seasonal bottom. On a good note, however, inventory is higher than last year, which contributed to the savagely unhealthy housing market.
Another storyline with inventory is taking hold now, and new listing growth once again is negative year over year. After mortgage rates spiked above 6% last year, fewer and fewer people have been listing their homes for sale. I had hoped that lower mortgage rates would get more people to sell their homes, but this wasn’t the case and now we are dealing with much higher rates.
The one good sign is that even though we are below 2022 inventory levels year over year, we are higher than in 2021. However, we are noticeably down from the 2019 levels.
Inventory levels:
For more historical perspective, in 2015 and 2016, new listing data for the same week averaged 76,913 with the two years combined, so being at 45,918 is low. The red arrow on the chart below shows how low inventory is relative to other years.
A traditional seller is a conventional buyer most of the time. In 2021, mortgage rates were low enough to keep demand much higher than it is today. Last year, rates started to rise, but they still needed to get above 4% to change housing dynamics. However, there is one bit of good news here.
In a typical marketplace, the days on market are more than 30 days. Last week, the existing home sales report showed — for the first time in a long time — that days on the market are over 30 days. This is a key indicator and one reason the housing market is no longer savagely unhealthy.
So while inventory and the new listing data aren’t much to talk about, one thing I truly believe is that if the days on market can grow, then inventory can accumulate higher. This was very hard to do with the days on the market being under 20 days, hence why we aren’t back to 2019 levels as a country. However, if the new listings take longer to sell, we can return to 2019 inventory levels in time.
NAR: Total Inventory levels are 980,000.

My 2023 forecast, where I lay out the case for inventory to reach 2019 levels, is running into a lot of trouble because of a lack of new listing growth. The days on market getting over 30 days and staying above that level is the only shot I have to be right this year and all it takes is to break over 1.52 million to reach 2019 levels.
While 2019 levels were at a four-decade low before COVID-19, we had a more functional housing market than we have experienced post-COVID-19.
10-year yield and mortgage rates
In my 2023 forecast, if the economy stayed firm, my 10-year yield range would be between 3.21% and 4.25%, equating to mortgage rates in a range of 5.75% to 7.25%.
The bond market tried to make a break under 3.42% on the 10-year yield, which I thought would be hard to do. It has failed to do that three times recently and now it is testing a break to a higher level. The back-and-forth action on the 10-year yield looks about right, considering the economy is still in expansion mode and the labor market is still solid.
Now If the economy breaks sooner than I anticipate, we could go under that 3.21% on the 10-year yield. Mortgage rates should get to 5.25% with a 10-year yield of 2.73%. This assumes the spreads are still vast. If they aren’t, then mortgage rates could go even lower.
I’m not a Fed pivot person, so I don’t believe the Federal Reserve members will publicly discuss cutting rates soon. This is why I didn’t believe the 10-year yield would break under 3.21% early in the year. For mortgage rates to go below 5.75%, we would need economic data to get weaker, and that has not happened so far in 2023.
Last week we saw stronger economic data, and bond yields stayed elevated the entire week. My Fed pivot rule, which means the bond market will get way ahead of the Fed when this happens, is that the jobless claims data needs to break over 323,000 on the 4-week moving; we are still under 200K on the weekly headline prints.
Now, the Fed will pivot at some point in the future. However, it needs the labor market to break because it believes the best way to fight inflation is for the labor market to get much softer. My target level for this is when the jobless claims break over 323,000 on the four-week moving average.
When that data line weakens, the bond market will get ahead of the Federal Reserve and send the 10-year yield lower. However, as we can see below, jobless claims are still below 200,000.
Oddly enough, everything looks about right to me regarding the 10-year yield range. If the 10-year yield had broken under 3.21% early in the year with the stronger economic data we have seen I would have been wrong in my forecast call. However, the data has stayed firm, and yield has yet to break under 3%.
The week ahead
There is less on the calendar this week for key economic data. We had pending home sales today, and we have the FHFA Home Price Index and the S&P CoreLogic, Case-Shiller home price index this week, plus a few manufacturing reports and durable goods orders.
Last week the economic data came in much better than anticipated and specifically the inflation data was stronger in this report than in the previous months. Jobless claims will always be a key report every Thursday, but the big labor data is coming out next week.
Higher mortgage rates have zapped the purchase application data, which ran well for a few months. If mortgage rates stay near 7%, it will be interesting to see if more people skip another year of listing their homes to sell — this would not be a positive for the housing market because this limits inventory growth and demand at the same time.
I understand this is a first-world problem, which means we have some pent-up demand when rates fall, especially below 5.75%. However, I prefer a bigger inventory buffer for that day than what we have today in America.
Until then, I’m hoping to see the housing market get back to some form of balance, and we’ve already gotten the first step — getting the days on the market back over 30 days.
Source link
Housing Market Tracker: Higher rates crush purchase apps
We created the weekly Housing Market Tracker because housing data has been so wild since 2020. The housing market madness persisted last week as inventory fell and higher mortgage rates took a bigger bite out of purchase application data.
Here is a quick rundown from last week:
Purchase application data
There is no way around this story; we had a solid streak from Nov. 9, 2022 to February of this year, when the purchase application data was trending positively as mortgage rates fell from 7.37% to 5.99%. Then rates went up almost 1% over several weeks, completely reversing the gains.
The 12 weeks of positive purchase application data are now in the system, and people who applied for a loan are looking and buying. How does the sharp increase in rates directly impact those homebuyers? Some who recently applied for a mortgage were looking to buy as rates fell, but now they may hold off purchasing until rates cool off again.
I call this rate lock risk, where some buyers don’t qualify or don’t want to continue the purchase until rates fall again. Rates spiking almost 1% in mere weeks is damaging because it can take some previous buyers out of play.
On top of that, the forward-looking purchase apps have been impacted negatively. As seen in the index below, we have returned to levels last seen in 1995.
The last two weeks in purchase apps look out 30-90 days. Some homebuyers have bought a home, which will show up in the upcoming sales data, as we saw a positive number in today’s pending home sales report. However, with the negative purchase application data, we have lost the continuous positive streak that started on Nov. 9.
Last week on CNBC I said I wasn’t surprised that new home sales data did better than anticipated, and we should see better existing home sales data in the next report. However, the positive trend story changed in the last two weeks, and it’s hard to get more stability when rates move up and down this much.
So, now we will have to track the sales data more closely to see whether some buyers didn’t end up pulling the trigger and if they come back later in the year if rates fall back to 6%.
Weekly housing inventory
Traditionally, weekly housing inventory bottoms in January and we see a regular rise in the spring and summer, then a fade in the fall and winter. Post-2020, inventory has been bottoming out later in the year, and I have a working theory on this. We have had three abnormal events in housing since 2020 that have all happened toward the end of the year, which has moved the timeline for the seasonal bottom in housing inventory.
Continuing with that theme, inventory has fallen again this week by 6,801, but we should be getting closer to the seasonal bottom. On a good note, however, inventory is higher than last year, which contributed to the savagely unhealthy housing market.

Another storyline with inventory is taking hold now, and new listing growth once again is negative year over year. After mortgage rates spiked above 6% last year, fewer and fewer people have been listing their homes for sale. I had hoped that lower mortgage rates would get more people to sell their homes, but this wasn’t the case and now we are dealing with much higher rates.
The one good sign is that even though we are below 2022 inventory levels year over year, we are higher than in 2021. However, we are noticeably down from the 2019 levels.
Inventory levels:
For more historical perspective, in 2015 and 2016, new listing data for the same week averaged 76,913 with the two years combined, so being at 45,918 is low. The red arrow on the chart below shows how low inventory is relative to other years.
A traditional seller is a conventional buyer most of the time. In 2021, mortgage rates were low enough to keep demand much higher than it is today. Last year, rates started to rise, but they still needed to get above 4% to change housing dynamics. However, there is one bit of good news here.
In a typical marketplace, the days on market are more than 30 days. Last week, the existing home sales report showed — for the first time in a long time — that days on the market are over 30 days. This is a key indicator and one reason the housing market is no longer savagely unhealthy.
So while inventory and the new listing data aren’t much to talk about, one thing I truly believe is that if the days on market can grow, then inventory can accumulate higher. This was very hard to do with the days on the market being under 20 days, hence why we aren’t back to 2019 levels as a country. However, if the new listings take longer to sell, we can return to 2019 inventory levels in time.
NAR: Total Inventory levels are 980,000.

My 2023 forecast, where I lay out the case for inventory to reach 2019 levels, is running into a lot of trouble because of a lack of new listing growth. The days on market getting over 30 days and staying above that level is the only shot I have to be right this year and all it takes is to break over 1.52 million to reach 2019 levels.
While 2019 levels were at a four-decade low before COVID-19, we had a more functional housing market than we have experienced post-COVID-19.
10-year yield and mortgage rates
In my 2023 forecast, if the economy stayed firm, my 10-year yield range would be between 3.21% and 4.25%, equating to mortgage rates in a range of 5.75% to 7.25%.
The bond market tried to make a break under 3.42% on the 10-year yield, which I thought would be hard to do. It has failed to do that three times recently and now it is testing a break to a higher level. The back-and-forth action on the 10-year yield looks about right, considering the economy is still in expansion mode and the labor market is still solid.
Now If the economy breaks sooner than I anticipate, we could go under that 3.21% on the 10-year yield. Mortgage rates should get to 5.25% with a 10-year yield of 2.73%. This assumes the spreads are still vast. If they aren’t, then mortgage rates could go even lower.
I’m not a Fed pivot person, so I don’t believe the Federal Reserve members will publicly discuss cutting rates soon. This is why I didn’t believe the 10-year yield would break under 3.21% early in the year. For mortgage rates to go below 5.75%, we would need economic data to get weaker, and that has not happened so far in 2023.
Last week we saw stronger economic data, and bond yields stayed elevated the entire week. My Fed pivot rule, which means the bond market will get way ahead of the Fed when this happens, is that the jobless claims data needs to break over 323,000 on the 4-week moving; we are still under 200K on the weekly headline prints.
Now, the Fed will pivot at some point in the future. However, it needs the labor market to break because it believes the best way to fight inflation is for the labor market to get much softer. My target level for this is when the jobless claims break over 323,000 on the four-week moving average.
When that data line weakens, the bond market will get ahead of the Federal Reserve and send the 10-year yield lower. However, as we can see below, jobless claims are still below 200,000.
Oddly enough, everything looks about right to me regarding the 10-year yield range. If the 10-year yield had broken under 3.21% early in the year with the stronger economic data we have seen I would have been wrong in my forecast call. However, the data has stayed firm, and yield has yet to break under 3%.
The week ahead
There is less on the calendar this week for key economic data. We had pending home sales today, and we have the FHFA Home Price Index and the S&P CoreLogic, Case-Shiller home price index this week, plus a few manufacturing reports and durable goods orders.
Last week the economic data came in much better than anticipated and specifically the inflation data was stronger in this report than in the previous months. Jobless claims will always be a key report every Thursday, but the big labor data is coming out next week.
Higher mortgage rates have zapped the purchase application data, which ran well for a few months. If mortgage rates stay near 7%, it will be interesting to see if more people skip another year of listing their homes to sell — this would not be a positive for the housing market because this limits inventory growth and demand at the same time.
I understand this is a first-world problem, which means we have some pent-up demand when rates fall, especially below 5.75%. However, I prefer a bigger inventory buffer for that day than what we have today in America.
Until then, I’m hoping to see the housing market get back to some form of balance, and we’ve already gotten the first step — getting the days on the market back over 30 days.
Source link