Dave:
Welcome everyone to On the Market. I’m your host, Dave Meyer, joined by Henry, James, and Kathy for a great show. How is everyone?
Henry:
Fantastic.
Kathy:
Wonderful.
James:
I’m doing good.
Dave:
All right. Well, today we’re going to dig into different markets across the country. As we’ve talked about a lot on this show, the housing market is really split and every market is behaving really differently. So we’re going to dive into different markets.
First, we’re going to do a little bit of trivia, and I’m going to see if any of you can guess some of the markets based on some of the characteristics of how they’re performing right now. And then we’re going to get into a Comeback Kid episode where each one of us has brought a market that was experiencing declines over the last six, 12 months, but we are expecting to take off again sometime in the near future.
So that’s our plan for today. So let’s get into our game where I’m going to ask you all to guess the market. Basically what I’m going to do is I’m going to read you three clues and at the end, each of you’re going to have a chance to guess which market this is.
For our first market, it has a median list price of $620,000. So that is well above the national average, which is about $400,000. Home values have increased 4% over pre-pandemic levels, but they have come down off their peak. And the third clue is that this city did not have a professional sports team until 2021. Kathy, you look very deep in thought, so I’m going to pick on you.
Kathy:
Sports team, new sports team. Las Vegas. That’s all I can think. Maybe. And Henry’s shaking his head no.
Dave:
That is a good guess. I’m not going to tell you that… Did they… I think… I don’t know when they got their first sports team, but it was recently. Henry, you know she’s wrong?
Henry:
No, I don’t know she’s wrong. I was nodding my head. I don’t think I was nodding it no, because I also think it’s Las Vegas. The throwing me is the average home price-
Kathy:
I know. Me too.
Henry:
620. That seems high for Las Vegas. But I’m a Raider fan and I know they just moved to Las Vegas recently and they hadn’t had a pro sports team before that. So I’m going to go Las Vegas.
Dave:
All right. James.
James:
I’m with Henry. I’m thrown off by the median home price. But then when did Las Vegas get their hockey team? That was like-
Henry:
Oh, that’s right. They had a hockey team before that.
James:
Man, I was going to agree with them until I just thought about the hockey team.
Henry:
And they also had the Las Vegas Aces. They had the WNBA team.
James:
Is it L.A? Because when did the Rams go there? No, they have tons of teams. What am I talking about?
Dave:
The Clippers, the Dodgers.
James:
I’m just throwing out Austin. I don’t even know.
Dave:
Okay. Well, James, you actually got it right. It was Austin.
James:
I was guessing more of tech cities. I was like, well, it’s Seattle like-
Henry:
But wait-
James:
Because tech’s around 600 to 700 typically.
Henry:
Wait, who’s in Austin? Who plays in Austin?
Dave:
Yeah, what professional sports team is it? I’m googling it.
Henry:
Is it like a soccer team?
Dave:
Okay. Henry, you’re right. Yes, it’s a soccer team. That’s why none of us knew it was the Austin FC, which is the first professional sports team. Shows how much we know about soccer. But that’s right. So I think this is kind of interesting. Austin. Las Vegas was a good guess, but I think the median sale price there is a lot lower.
Kathy:
Yeah, that wasn’t matching.
Dave:
But it is interesting that despite Austin’s pretty big correction that they’re in, still above pre-pandemic levels, but only 4%, which is pretty small compared to all the other… Even other markets that are in a correction right now are still up way more than 4% over pre-pandemic levels. All right, James, that was pretty impressive. Pretty impressive guess right there.
All right, well, let’s go to our second market. This one, right around the median national price. We have the median home price of $389,000. This market has seen huge job growth. 84,000 jobs have been added just since 2021. And most importantly of all, the Cuban sandwich was invented here. James, since you’re the winner?
James:
Miami?
Dave:
That’s a good guess.
James:
Wait, wait. What was the medium home price?
Dave:
389,000.
James:
Oh, that can’t be right. That can’t be right. Charlotte?
Dave:
All right. Henry?
Henry:
Yeah, obviously I’m thinking of a Florida city. Yeah, so like Fort Lauderdale.
Dave:
All right. Kathy?
Kathy:
I’m going to go with Miami just because.
Dave:
All right. The Florida theme was right. Cuban sandwiches. But it is actually Tampa, Florida. Kathy, that’s your market. Kathy, be honest. Have you ever had a Cuban sandwich when you’re in Tampa?
Kathy:
Never. No.
Dave:
That’s a shame. I’ve never been to Tampa. But let’s go and get some Cuban sandwiches,
Henry:
Aren’t you the DataDeli? How have you never had a Cuban sandwich in the home of the Cuban sandwich?
Dave:
I don’t know. This needs to be rectified immediately.
Kathy:
I don’t even remember seeing signs for one when I’m there.
Dave:
All right, so no one was there. James still has the lead. Market number three, though, median list price almost exactly the same. 389,000. One of the fastest growing cities in the entire country with a 2.8% population growth since 2022, which is huge, just for reference; it’s usually below 1% even for fast growing cities. And this city is named after an English explorer. I have no idea. Kailyn, this is a good one because no one’s going to know. All right, Henry, you’re up first.
Henry:
Come on. I don’t know. Columbus, Ohio?
Dave:
Oh, that’s pretty good. He wasn’t English, though.
Henry:
Yeah, exactly.
Dave:
All right. Kathy?
Kathy:
Mr. Dallas? I don’t know. [inaudible 00:05:56] Dallas?
Dave:
Mr. Dallas. Yes. The famous Mr. Dallas.
Henry:
The famous English explorer, Mr. Dallas.
Dave:
Yes. I remember him fondly from high school world history class. James, what do you got?
James:
I don’t know. Kensington?
Dave:
Is that even a place? Isn’t that like the ketchup, Mr. Kensington? That’s like that fancy ketchup?
James:
It sounds English.
Dave:
It does sound English. No, it is Raleigh, North Carolina, one of the fastest growing places. Wow. And it is according to Kailyn, it is named after Sir Walter Raleigh, an explorer and nobleman who funded the first expeditions to the coast of modern day North Carolina. Can’t believe you guys didn’t know that.
Kathy:
It all makes so much sense now.
Dave:
Well James, I think you won this because you were the only one who got that right.
All right, well that was fun. But we are going to get into markets that we actually know something about in the next segment. But first we’re going to take a quick break.
All right. Welcome back everyone. We are now going to jump into our comeback kid markets. Again, as we talked about at the top of the show, these are markets that have seen a correction over the last couple of months, but as the housing market, on a national basis, is starting to find its footing a little bit, I think it’s too early to call a bottom on a national level. There are definitely certain markets that are starting to see a rebound, at least for now. And we’re here to try and predict and talk about some of the markets that we think have the strongest potential to rebound throughout the rest of this year.
Henry, let’s start with you. What market do you think has the best chance of rebounding?
Henry:
Yeah, I went with Austin, Texas, which is sad that I didn’t know the answer that Austin had a professional sports team, but none of that came up in my research.
But I went with Austin mainly because I’m going to start with the end first. So the main reason I chose Austin is because the key factor in real estate is always location, right? Location, location, location. And people have been moving to, and living in, Austin because of the location, because of the amenities that it provides, because of the music life and the nightlife and the indoor/outdoor kind of living and all for essentially what can be considered a reasonable cost of living if you compare it to coastal cities or in the far east coast. And so you kind of get a little bit of lifestyle and some affordability. And so even though the pandemic caused this market to skyrocket and then now fall back to reality a little bit, the lifestyle there is still the same and people still want to enjoy those amenities.
So I think as the market moves closer to where it was pre-pandemic, it’s going to just encourage more people to go there. When I say people, I don’t just mean people. I also mean businesses. People work at businesses. Businesses want to be able to enjoy these amenities when they’re not at work. And so they move. There’s several companies who have either relocated or opened up offices in the Austin, Texas area. You’ve got Oracle moved their headquarters from California to Austin and they did that in 2020. BAE Systems moved their office. They’re a defense contractor, essentially. They moved their offices to Austin in 2021. HP. Everybody knows who HP is. They moved headquarters from California to Spring, Texas, which is just outside of Austin. So these are big employers that employed lots of people across a couple different industries. And it’s cheaper for them, I’m sure, than what it costs them to office and have headquarters in California and other cities. And so that’s bringing people because people work there. And as those companies continue to grow, more people work there.
Some stats that I did find interesting: population growth has gone up year over year since 2020. So it went up about 3% in from 2020 to ’21, 2.79% from ’21 to ’22, and then 2.39% from ’22 to ’23.
Dave:
That’s got to be like one of the fastest growing markets in the country.
Henry:
It is. It is the fourth fastest growing city in the US. And it ranks number one in growth rate among cities with over a million people. So it rapidly growing.
And the median home price, if you look at home values in 2021, average price was 451. In ’22 it was 567. So it jumped 26%. And now in ’23 it’s 530,000. So it’s down 15% from last year, but it’s still up from the 451 from pre[pandemic levels levels, going back to what we talked about in the last segment with Austin.
And so I think it’s a comeback city because the location is still phenomenal. The cost of living, when compared to other cities, is still fantastic. Companies are moving here, which is bringing jobs. People can still work remote in a lot of companies, so they’re wanting to move places where they would enjoy the lifestyle. And I just think that’s going to cause this place to continue to boom as the market softens.
Kathy:
Yeah. And with all those tech companies moving from California, that’s one big reason that people are moving there. But it’s really the tagline of Austin is why Californians are moving there. Keep Austin weird, right? Yeah. So we’re going to do that as Californians as we move out there. We’ll just keep it weird.
Henry:
California said, hold my beer. We got you.
James:
Henry, I love this pick because I’m a firm believer that the tech cities are going to all make comebacks right now. I think the pandemic got… Everything changed so much during that time where people could work remote. They were moving around. These tech companies have been very clear they want people back in the office and things are getting back to normal. And these are where all the jobs are right now. There’s massive growth in all these cities. There’s lots of job openings across the board. Income is rising.
The only thing I would say about Austin as a whole is it’s a very large geographical area. I don’t know if the outskirts are going to do… Randomly, the guy that won me at the BP Con was from Austin, Texas. He’s a flipper out there. He texted me last night and he said his inventory’s stacking up everywhere on the outskirts. And so that would be the only thing that would maybe hold that city back a little bit is just the sheer size of it. And there’s so many different income pockets in that size that it could skew the math a little bit. But I think the core city where the jobs are will be growing pretty strong.
Dave:
The only other thing I’d add… I agree; I think Austin has one of the best long-term potentials of any city in the country, if not the single best. And if prices are coming down, it could be a good opportunity to buy.
The thing I would caution against is Austin is one of the most overbuilt cities in terms of multifamily specifically. And that could create some competition and some stagnation of rent growth even in single families in the short term just because there’s a lot of supply coming online in Seattle. And that is also – spoiler – true of the city that I am going to present. This naturally happens.
Henry, this is a great pick, but you’re not the only person who sees Austin as a great long-term buy. So builders see that and they start buying and building like crazy. And when we enter a correction like this, it’s looking like it’s poorly timed. So that might play out in Austin, at least over the next couple of months.
All right. Well, great pick. Kathy, what about you? Where are you expecting a big comeback?
Kathy:
Well, it’s so funny. Just one comment on Austin. This is an example of why sometimes cashflow shouldn’t always be the thing to focus on. Because I remember, I’ve been doing this a long time, but 15 years ago I would always say, ah, I’m not going to buy an Austin because it just doesn’t cashflow. And back then the average price there was, I don’t know, 200,000 or something. I’m like, it just doesn’t cash flow. Henry, what’d you say the medium price is now?
Henry:
The medium price of 2023 is 530,000.
Kathy:
Yeah. So it’s one of those examples of sometimes when you see all those factors in play, maybe it’s okay to break even. Maybe it’s okay to just hold that property knowing that there’s going to be so much growth.
And that is how I feel about the market I’m going to present. We have a development nearby, as you guys know, but Salt Lake City is the market that I’m focused on. It’s getting hit a little bit hard right now. There is increased inventory for sure, but those fundamentals are there, like I saw in Austin many years ago. What’s happening in Salt Lake is really massive population growth. And the factors that I follow, I know you guys do do too, is number one is population growth. I want to know that people are moving there and want to be there and aren’t leaving. And usually population growth comes from job growth. People move where the jobs are. And when you can still get affordable properties in those markets, to me, one of those places where you just sit and wait it out. And even if the cash flow is not great, when you have just massive population and job growth, you’re probably going to be okay in the end.
So what’s happening in Salt Lake is the population has increased 161% over the past 10 years. And the fertility rate is 3.4. Nationwide, it’s 1.8 to 2. So lots of baby boom in Salt Lake. Of course, that probably has a lot to do with the Mormon population there where families do marry… They’re formed very young and of course have a lot of kids. So we’re just seeing outstanding population growth there.
Jobless rate is 2.2%; lowest in the country, 43,000 new jobs. Zillow forecast growth of 1.4% next year. So these are just some of the basic reasons why I’m bullish on Salt Lake. And of course we do see a lot of tech companies moving there as well to the Silicon Slopes as they call it.
Dave:
Well, I was going to agree with you, Kathy, but if Zillow is forecasting growth, that probably means it’s going to decline.
Kathy:
I think it’s wrong in the sense that it’s going to be higher than that, honestly. Because it already is. It’s already showing that it’s coming back. It’s a comeback city. One of the things… This is a cool slide on the youngest cities. And you know what? Seattle is number one, Denver second, but Salt Lake’s on that list too of the median age being five years younger than the national average.
Dave:
Oh wow. Well, if I was giving up points for this presentation, I would give you some points for bringing in fertility rate. I think that’s a new data point on this show. I don’t think we’ve ever had that, but it totally makes sense. It’s a good one. James, Henry, what do you guys think?
Henry:
I think she gets points with the fertility rate and loses points on the Zestimate.
Kathy:
Fair. I’ll take it. When they change their forecast, I don’t know, five times or something. I want to do that. I want to forecast and then just change it every month.
Henry:
I mean, that’s what forecasting is, right?
Kathy:
That’s true.
Dave:
Yeah, it is. That is exactly what it is. It’s better than just pretending that something that you already know is wrong is still-
Kathy:
It’s still right. Yeah.
Dave:
Yeah. So I think updating the forecast is still a good idea.
Kathy:
It’s fair. The world changes so quickly.
James:
Yeah, I love Salt Lake City. I’ve been there a few times and the quality of living’s really good there. You can just tell as you go around, everything’s clean. There’s good infrastructure there. I don’t know a whole lot about the job growth and economy there. But I kind of foresee that being more of a stable market than seeing it kind of hockey stick back up. I think there’ll be more steady growth. I think these other secondary cities are going to be more going into the steady, stable growth and they’re going to fall behind these tech cities with the comeback. But I do think they’re good quality living. There’s a lot of people living there. Shoot, I tried to go skiing at Kathy’s… We stayed at Kathy’s development and we tried to go skiing. There were so many people, I had to turn around and leave. I was like, this is unreal.
Kathy:
It was packed.
James:
It was packed. So there definitely is a lot of bodies there.
Henry:
I think the outdoor lifestyle is going to draw lots of tourism, which brings money in that supports that community that and the people don’t stay. So I think that’s going to help. My concern is long term job growth. So if they’re having such a baby boom and there’s going to be so many people, if they don’t continue to have increasing job growth, then where are all these people going to work and how are they going to continue to produce for their families?
Dave:
All right. Well, I like it. James, what about you? Are you on the Austin/Salt Lake bandwagon or you got something else?
James:
I like Austin. I like the tech cities on the comeback. I feel like they got overcorrected a little bit during those rate hikes. But I’m a repping my backyard, Seattle, Washington. I think that is going to be the biggest comeback kid market and mostly because I’m living in it right now and it just feels different. We put a house up for sale on Friday, had four offers in three hours on it, and we were at the top end of the pricing. And what I’m seeing is if you have a good product in a good neighborhood, that stuff is selling and it’s selling for above list. Things trading below list now in this market is not happening. And who knows, we might be seeing a seasonal change.
The main reason like Seattle is the population is growing. We have so many jobs. People can get good paying jobs. There’s no income tax in this state. And so people can… They get to save more. They get to walk with more in our state, and that’s a big benefit. But Seattle’s population increased 2.4% from 2021 to 2022, and they’re anticipating the same growth. That is the fastest growing city in 2022.
So there’s growth and the companies are also growing rapidly as well. Like we’re watching Amazon, Facebook, Microsoft, expand out their campuses. Microsoft’s building out a campus that’s being built over a 10 year period; that’s how big it is. And they’re ready to fill these places up with bodies, which means good paying jobs are going to be in our market.
Home values, what we’ve seen is we’ve seen this hockey stick back up. This is really interesting. So we saw the median home price drop down in December to 754,000. That was a huge drop from the previous 12 months. But recently we are now sitting, since December, we’re at 840,000. We’re seeing this swing back up and I’m seeing it in real time data.
We were comping a property in Bellevue yesterday and Bellevue, Washington’s a nice suburb city right outside Seattle. Properties that we’re selling for 850, 90 days ago are now selling for 1.15 to 1.2 in the exact same condition. And we’re seeing this rapid growth. There’s very, very little inventory. Our inventory went up to about two and a half, almost three months. We’re back down to under a month worth of inventory. And so things are getting consumed and there’s a lot of buyers in the market. So any market that has that much pent up buyer demand with no inventory, regardless of rates, there’s transactions going down.
And the transactions are trending up, not trending the other way. And I think that comes down to a lot of these tech cities. They’re smart buyers. They like to overthink things. And when these rates spiked up, they all went on the sidelines for a minute. They saw it kind of come down and then they saw it stabilize out and now they’re having massive FOMO and they’re jumping in. And as they’re jumping in, values are going up.
Rents are also still climbing. There’s massive rent growth the last two years; I think it was 23% rent growth over the last 24 months. And we’re still seeing it grow. It’s growing at a more stable pace, but we have not seen the decline like Austin saw. It grew at 2.7% in the last 60 days on rent growth. We saw a little bit of a dip for that last quarter in ’22, but not much and now it’s growing it as the cost of housing is going up, with the interest rates and the monthly expenses, so is rent. So rent is getting pulled up as well.
So all the key indicators are showing that it’s rebounding really well and things are increasing. And not only are the values increasing, the wages are increasing. Wages are up 5% year over year. So there’s a lot of jobs in the market. 119,000 open jobs, people are getting paid more and there’s no inventory. And so the people with jobs want to settle in. And that’s what we’re seeing is the market is rebounding pretty consistently.
Kathy:
That is so shocking. Really, that people can buy those high priced homes with today’s interest rates and that they’re not the shortage of them. Are they paying cash? I mean, who are these people?
James:
They’re financing the deals. That’s the thing. There’s a lot of financing. And we’re also down in SoCal and the competition, I know, that is growing too right now. Like Newport Beach is accelerating still. That’s cash buyers. I’m seeing it. People are stroking big checks for houses. This is, they’re financed tech buyers that are putting about 25% down. They’re your standard buyer. And I was a little shocked too because if you really think about what the average tech workers making, around a hundred grand a year, and the housing cost is pretty expensive. People are paying five, six, $7,000 for these houses in these neighborhoods. It does surprise me, but they are transacting. I think there is also still a lot of cash that is sitting in people’s banks right now and they’re just utilizing it. There was so much cash printed, people made so much money the last 24 months. Now they’re just putting it to work.
Kathy:
I mean, I was just under the impression that they were feeling depleted after the stock market went down and they lost their money in crypto and so forth. But if some of these people are from California and they’re buying a million dollar house, they may be leaving a 2 million house or a 3 million house. And so perhaps it is more affordable for them from that perspective. But if they’re not, if they’re just locals, it’s still, like you said, if they’re making a hundred thousand maybe per person and it’s a couple, it still seems like a stretch. But it’s amazing.
Dave:
I think the other really interesting thing about Seattle, and honestly a lot of these markets, is that the tech, we’ve seen a lot of high profile tech layoffs, and I think that perhaps led to some fear, particularly over the winter. People were sort of waiting to see what happened. But from some of the data… I mean, we see the labor market data, which is pretty darn strong given where we are in the tightening cycle. But I was reading something the other day about how ChatGPT has all of these major companies like Microsoft, Google, all of them in this arms race again now, and they’re staffing up again. They’re all trying to hire quickly to try and get the best AI engineers and be able to beat each other to the market. So it’ll be really interesting to see if the very well publicized layoffs in tech slow down and we start to see these tech markets start to take off again.
Henry:
You talk about the stock market. The stock market’s been kind of rebounding over the past couple of weeks. I know my portfolio’s looking better than it has in a long time. And so I think people are starting to see some of that positivity. I think if the interest rate hikes slow down, stop, or reverse, I think you’re going to see a boom in these markets, especially one like Seattle with such great fundamentals. Because you’ve got the jobs, you’ve got the job growth. It’s a place where people want to live. It’s desirability. I don’t like rain a lot, so I don’t want to live there, but lots of people enjoy that part of the country.
I think if you’re waiting on the sidelines or you’re looking for a place to invest, thinking about a place that has these strong market dynamics and fundamentals, I think it’s such a sweet spot right now because the rates haven’t completely changed direction yet. And I think once they do, it’s going to create this big bump or demand. And so there’s this sweet spot where you can get in right now, especially if you can buy at somewhat of a discount. And then even if that property, like Kathy said, breaks even, when you’re buying in a market with these great fundamentals, you know it’s a waiting game. And if you can hold that property long term… You may not even have to hold it that long depending on what happens with rates. But if you can hold that property long term, I think you’re playing the market conditions safely.
Kathy:
I do want to share one last thing that Marcus and Millichap Research Services came out with the employment pre-pandemic percent change. So which cities have more jobs now than pre-pandemic? And interestingly enough, Austin came number one with 14% more jobs now than before the pandemic. Dallas was second with 9.9 and Salt Lake was third with 9% more jobs than pre-pandemic. And Seattle’s not on the list, but maybe that’s because Seattle already had so many jobs that… I don’t know, but I think that’s interesting.
James:
You just made my hand sweaty, Kathy.
Kathy:
But I mean there were already so many jobs up there that and just obviously not enough real estate for all the jobs that are there.
Dave:
All right. Well, for our last market… I guess this is a theme; I picked one that’s sort of in line with what the three of you have already picked. It is the home, if you know these places, home of Qdoba, Chipotle, all sorts of other fast food restaurants. And that is of course, Denver, Colorado where I am just like James and I’m just a homer, picking the market I know best.
But I really believe that Denver, like these other cities, is poised for really big comeback for some of the same reasons we’ve been talking about, is really strong fundamentals. The population growth has been very strong for 15 years. Prices have dropped a little bit, so they’ve become a little bit more affordable, but it is heating up really quickly. Days on market in Denver have dropped down to just 11 days right now. Yeah, so we’re seeing a lot of activity.
And actually, I texted my real estate agent to just ask him, is the data we’re seeing real? And he said that just this week he had two clients that both offered 70,000 over asking with an appraisal gap and did not win either of them. So that’s a 15% over asking and they’re not winning. So I don’t know if this means that the bidding wars and crazy appreciation is coming back, but just shows what happens in a market with strong fundamentals when there’s no supply. People still want to live there. And so I think Denver, especially after the Nuggets winning the NBA championship the other day-
Henry:
Oh, slid that one in there.
Dave:
Absolutely. Because we have actual, real professional sports teams in Denver. Unlike Austin.
James:
The Nuggets just crushed that playoffs.
Dave:
Yeah, they’re amazing. I unfortunately couldn’t watch because game five was on at 2:30 in the morning. It started at 2:30 in the morning.
Henry:
So you’re not that diehard of a fan?
Dave:
No, no. I’m more of a Knicks fan and they’re just terrible.
Kathy:
They’re going to have to change their name from Nuggets to Boulders or something. They’re playing big time.
Dave:
I think people like the Nuggets name for a few reasons.
Henry:
Okay, I get it. I get it.
Dave:
All right. Well, what do you guys make of this? I mean, I think we all sort of picked similar things. We did not plan this out, but it seems like we’re all sort of aligned that these big cities, they’ve seen a correction and they are starting to come back. Is that the general sentiment? Do you think other markets are starting to come back? Were there any others you’re considering?
Kathy:
I mean, these three cities, we said Austin, Salt Lake and Seattle are big tech cities, and anyone who thought that tech was dead because there were layoffs is just not realizing the next 10 years is going to be so tech heavy. The changes that are coming. I mean, we’re just at the beginning of technology ruling our lives, of controlling the world. It’s coming and it’s going to be massive. And I think you’re just not going to go wrong in a tech city.
James:
I agree with Kathy. I think that’s just where the jobs and the potential are. That’s why they have such booms in general. But ones that boom also settle down. And I think the other big cities that did boom, like Phoenix, Vegas, are going to not have the same rebound because just the jobs aren’t there. But the tech makes a big driver.
The biggest surprising thing I’ve heard though today was actually when Dave was talking about… I didn’t know Denver’s the home of fast food because everybody is so fit in Denver. I’m shocked. It’s just the home of beer and fast food and people are still fit there.
Dave:
Well, I should say fast casual. We’re not [inaudible 00:31:05] McDonald’s. But honestly, it’s crazy how many of them there are. It’s like Qdoba, Chipotle, Quizno’s, Smashburger, they’re all started there.
Henry:
Why would you be surprised that Denver is the home of the places where you want to get munchies?
Dave:
Okay, Henry. All right, this started-
Kathy:
Well played.
Dave:
… well before the law in question.
Henry:
No, we need burritos, guys. We need a lot of burritos.
In all seriousness, I think a lot of this goes back to some of the things we’ve talked about for a long time on this show. I remember when rates were spiking. We did a show where we had a conversation where we essentially were saying, at some point these high rates just become normal. And when life normalizes, people don’t just move because of financial decisions, they move because they want to. They move because of life changes. They move because of job changes. And life will continue to happen. And the more comfortable people are with the market dynamics, the more they’re going to jump in. I think what’s been holding people back is the level of uncomfortability or uncertainty that’s out there. But if people start to feel more comfortable even with the volatility, or more comfortable even with the higher rates, you’re going to see more buyers enter the market. And I think that’s just going to help a lot of markets start to rebound a little bit. Obviously the ones with the better market dynamics will rebound harder.
Dave:
Well said. Well, what a good way to get out of here. Thank you all for doing all this homework and bringing these shows. This was a lot of fun for Henry, James and Kathy. I’m Dave Meyer. Thank you all so much for listening. See you next time for On The Market.
On The Market is created by me, Dave Meyer and Kailyn Bennett, produced by Kailyn Bennett, editing by Joel Esparza and Onyx Media, research by Puja Gendal, copywriting by Nate Weintraub. And a very special thanks to the entire BiggerPockets team. The content on the show On the Market are opinions only. All listeners should independently verify data points, opinions, and investment strategies.

 :215-447-7209
 : deals(at)frankbuysphilly.com
New home sales defy recession calls
New home sales are up 20% year over year, and existing home sales are down 20% year over year; this is something we don’t see very often. One group has the advantage here while the other doesn’t: The new home sales market is minuscule versus the existing one, and the builders sell their homes like a commodity.
Last year a theme of mine was that new home sales are historically low, and the builders know how to move products when needed. This means they will cut prices, buy down rates, and do whatever it takes because they’re in business to make money. They have no emotional ties to houses and don’t need to sell a home to buy another one. They’re effective sellers and don’t want to create a backlog of completed units for sale because that would ruin their business model.
Case in point: Today we have 69,000 new homes completed and ready to sell, as shown below. The builders have managed their backlog nicely to ensure this data line doesn’t explode higher on them like we saw in 2008. An average number would be around 80,000 homes for sale, so we are returning to normal.
But a bigger story here is that the builders’ biggest competition isn’t other builders — it’s the number of existing homes on the market. Existing homes are cheaper and have a geographical advantage because they’re all over the map. In 2007, we had more than 4 million total active listings, which was too much supply for the builders to compete effectively. Today, the total number of active listings according to NAR is 1.080 million, and that number is down year over year.
NAR total active listings data going back to 1982:
This explains why the builders and new homes are doing better than the existing home sales market, which deals with higher mortgage rates and low active listings. Some people prefer something other than the current active existing inventory. This means new homes — with all the bells and whistles — can peel some buyers from the existing home sales market, especially if they pay down mortgage rates.
Now on to the report.
From Census:
New Home Sales: Sales of new single‐family houses in May 2023 were at a seasonally adjusted annual rate of 763,000, according to estimates released jointly today by the U.S. Census Bureau and the Department of Housing and Urban Development. This is 12.2 percent (±12.8 percent)* above the revised April rate of 680,000 and is 20.0 percent (±15.5 percent) above the May 2022 estimate of 636,000.
As we can see in the chart below, new home sales aren’t booming like what we saw at the peak of 2005 but are getting back to trend sales growth from the bottom we saw when rates got 5% in 2018. New home sales can be wild monthly, so if we see some negative revisions to this report, just remember: it’s the trend that matters, and it’s gotten much better here.
Also, in the chart below, we can all agree it isn’t housing 2005 or housing 2008 with new home sales.
For Sale Inventory and Months’ Supply: The seasonally‐adjusted estimate of new houses for sale at the end of May was 428,000. This represents a supply of 6.7 months at the current sales rate.
As home sales improve, the builders are winding down their monthly supply, which is good for the economy. I have a straightforward model for when the homebuilders will start issuing new permits with some kick. My rule of thumb for anticipating builder behavior is based on the three-month supply average. This has nothing to do with the existing home sales market — this monthly supply data only applies to the new home sales market and the current level of 6.7 months.
Housing permits will follow since this data line improves as new home sales keep growing. The model below has been my bread and butter for years:
The current data has seen significant improvement, as the chart below shows. Also, the only bubble crash this year has been in cancellation rates, not existing home sales prices.
Also, it’s vital to break down the monthly supply data into different supply categories.
This is a solid report today as the builders are moving products and making deals to get buyers in. I love it.
Housing has always been used as an indicator of the economy. As the builder confidence data rose, many pessimists ignored it because they assumed it was a dead-cat bounce. Now that we are almost to July 4, 2023, it’s a wake-up call. I ask my bearish friends who use housing as a leading indicator going into recession and out what they believe the data is telling them now. So far, I haven’t heard back.
Home Builder Confidence Index
The builder’s confidence index is gold because the builders are thinking about making money, whereas some indexes might have a political or ideological twist. I track the builders’ confidence and the 10-year yield because these two are essential for housing. This report is a plus for the economy because construction worker employment risk will decrease if sales continue to higher and mortgage rates can fall.
This article aims to show how much progress we have made in this sector and why it’s happening. The report today is a positive story for the U.S. Hopefully, this trend continues because the best way to deal with inflation is always with supply, not demand destruction. Demand destruction is a short-term fix, but supply needs to grow over time to beat inflation.
Source link
Eviction filings are up more than 50% in some cities compared to pre-pandemic levels
Eviction filings have risen more than 50% in some cities when compared to pre-pandemic levels, as expiring relief measures and economic volatility play havoc with the finances of renters in certain parts of the country.
This is according to data from the Eviction Lab at Princeton University, as reported by the Associated Press.
“Protections have ended, the federal moratorium is obviously over, and emergency rental assistance money has dried up in most places,” Daniel Grubbs-Donovan, research specialist at the Eviction Lab told the AP. “Across the country, low-income renters are in an even worse situation than before the pandemic due to things like massive increases in rent during the pandemic, inflation and other pandemic-era related financial difficulties.”
Eviction Lab tracks data in roughly 36 cities and 10 states, finding that eviction filings are more than 50% higher in certain areas. Landlords file about 3.6 million eviction cases each year, according to the organization.
Among the cities with the highest rates, Houston came in the highest. Evictions there were 56% higher in April and 50% higher in May, according to the data. In Minneapolis/St. Paul, rates were 106% higher in March, 55% higher in April and 63% higher in May. Nashville was 35% and Phoenix was 33% higher in May, while Rhode Island was 32% higher in May.
“The latest data mirrors trends that started last year, with the Eviction Lab finding nearly 970,000 evictions filed in locations it tracks — a 78.6% increase compared to 2021, when much of the country was following an eviction moratorium,” the Ap report said. “By December, eviction filings were nearly back to pre-pandemic levels.”
Rent prices have also steadily increased, being roughly 5% higher in 2023 over last year, and over 30% higher in 2023 when compared to 2019 according to data from Zillow as shared in the report.
As federal relief programs from the pandemic are increasingly expiring or becoming phased out, calls for additional resources from Congress have failed to gain any significant momentum, particularly as concerns over spending dominate the legislative agenda of the U.S. House of Representatives.
The expiration of eviction moratoria is also leading to higher rates of eviction. But similarly to a lack of will seen in the U.S. Congress, a number of state legislatures have not seen any meaningful legislation emerge to combat the trend, despite organized efforts in states like New York and Texas.
However, several pandemic housing relief measures have been made permanent.
Nationwide, 200 measures have passed since January 2021, including legal representation for tenants, sealing eviction records and mediation to resolve cases before they reach court, according to the National Low Income Housing Coalition.
Source link
MAXEX lands equity investment, partnership to expand liquidity
Digital mortgage exchange and loan aggregator MAXEX announced on Monday it closed an equity investment round and partnerships to expand liquidity amid the recent market volatility. Terms of the transaction were not disclosed.
The investment round was led jointly by the financial institution South Street Securities Holdings and the investment firm Atlas Merchant Capital, headed by former Barclays CEO Bob Diamond. (Atlas also has a minority investment in South Street.)
The three companies will collaborate to accelerate industry adoption of MAXEX’s platform and expand access to MAXEX and South Street products and services. The companies claim they collectively serve more than 500 market participants.
Several of MAXEX’s existing investors, including J.P. Morgan and Moore Asset Backed Fund, also participated in the round.
Houlihan Lokey served as the financial advisor to MAXEX.
“MAXEX’s mission is to serve as a market utility and liquidity provider for the U.S. mortgage markets,” Tom Pearce, CEO, chairman and co-founder of MAXEX, said in a statement. “This partnership enables us to further accelerate our growth, expand our product suite and broaden our network.”
South Street will provide capital support to MAXEX’s existing clearinghouse facility as part of the deal.
It will “further enhance MAXEX’s counterparty strength by leveraging South Street’s investment-grade rating and approximately $30 billion balance sheet,” the company said in a statement.
According to Jim Tabacchi, president and CEO of South Street, “Recent market volatility emphasized the need for fundamental change in the mortgage secondary market as lenders and investors struggled to adapt to rapidly rising rates, liquidity shortages, and the need to operate with more nimble, flexible infrastructure.”
The deal with MAXEX expands access to a broad range of non-agency and agency-eligible mortgage loan programs.
“This partnership enhances our offering and TBA pipeline hedging platform by giving clients access to MAXEX’s loan trading exchange,” Tabacchi said.
In May 2022, MAXEX launched a DSCR [debt-service coverage ratio] loan-purchasing program for originators looking to tap into the growing mortgage demand from individual and small-business real estate investors, such as rental property owners, who “tend to prioritize property cash flow over interest rate.”
The company also announced that it expanded its bulk- and forward-trading loan programs.
In September 2022, the digital mortgage platform unveiled a series of new programs designed to serve originators and loan buyers in the growing non-QM lending market.
Source link
Fannie Mae lowers 2023 single-family originations forecast to $1.59 trillion
Current housing market dynamics continue to be fueled by the lack of existing homes available for sale, a trend that did not improve during the spring homebuying season, when more homes are typically put on the market. This has led Fannie Mae to revise its 2023 single-family originations forecast to $1.59 trillion, down from $1.65 trillion.
This lack of inventory has also resulted in the return of home price growth in recent months and has boosted new home construction, Fannie Mae‘s Economic and Strategic Research (ESR) Group said Monday.
While the flow of new listings remained suppressed for much of 2022 due to a mortgage rate lock-in effect, the slower pace of sales led to a build-up of active inventories for sale and a modest decline in national house prices in late 2022, the ESR group explained.
Single-family housing starts surged 18.5% in May to a seasonally adjusted annualized rate of 997,000 units.
Single-family housing permits, which tend to be more indicative of the underlying trend, also rose, but by a smaller 4.8% and to a seasonally adjusted annualized rate of 897,000 units, well below the pace of starts.
Still, the permits data points to a clear upward trend in recent months, and this coincides with improvement in homebuilder sentiment. Homebuilder confidence moved into a positive territory for the first time in nearly a year amid recent data from the U.S. Census Bureau showed that about 1.69 million single-family and multifamily housing units are under construction across the country in May, nearing the highest levels recorded in the last 50 years.
Without a broader economic slowdown, current home prices and lack of existing inventory will lead to more home construction, Fannie Mae’s ESR group projected.
Doug Duncan, senior vice president and chief economist, pointed out that housing prices continue to show stronger growth than what was previously expected given the “suddenness and significant magnitude” of mortgage rate increases.
Homebuilders continue to add to the supply of historically low inventory levels, but years of meager homebuilding over the past business cycle means the imbalance will likely continue for some time, according to Duncan.
The ESR group projects single-family mortgage originations for 2023 to be $1.59 trillion, down from its previous forecast of $1.65 trillion. In 2024, about $1.90 trillion origination volume for total single-family houses is projected, also down from the previous forecast of $2.03 trillion.
Fannie Mae reiterated that the economic downturn remains a question of “when” rather than “if.”
The ESR group expects a modest recession in the fourth quarter of 2023, a shift from last month’s forecast from the beginning of the second half of the year.
“We do expect housing will be supportive of the overall economy as it exits the modest recession,” Duncan said.
The good news is that ongoing resilience in employment, strong housing demand, and current financial conditions do not point to an immediate downturn.
Fannie Mae upgraded its 2023 GDP forecast to 0.1% from -0.3% on a Q4/Q4 basis while it downgraded its 2024 GDP forecast to 0.8% from 1.2%.
Source link
4 Comeback Housing Markets That Could Rebound in 2023
Looking for housing markets with population growth, new jobs, rising home prices, and unlimited profit potential? If so, you’re in luck! In this episode, we’ll reveal four of our favorite “comeback” housing markets primed to explode over the next few years. Thanks to the recent housing correction pushing home prices lower, some top investing areas are sitting on suppressed prices that might not last long. So, what are our top markets?
First, we head down south to talk about an explosive city that tanked in property pricing but now looks like a strong buy. Then, we’ll head to the Silicon Slopes to break down why this new tech hub (and ski city) boasts some surprising metrics that could mean more money for rental property investors. From there, we’ll enter into the dense forest and fog of an iconic city that isn’t even close to past its prime. Finally, we’ll finish with a nugget of wisdom from Dave on why this “fast food city” might be worth more than its munchies.
So, if you’ve been preparing for your next out-of-state investment or are just looking for a market that’ll bring you long-term growth, tune in to hear where our experts are planning their property purchases!
Dave:
Welcome everyone to On the Market. I’m your host, Dave Meyer, joined by Henry, James, and Kathy for a great show. How is everyone?
Henry:
Fantastic.
Kathy:
Wonderful.
James:
I’m doing good.
Dave:
All right. Well, today we’re going to dig into different markets across the country. As we’ve talked about a lot on this show, the housing market is really split and every market is behaving really differently. So we’re going to dive into different markets.
First, we’re going to do a little bit of trivia, and I’m going to see if any of you can guess some of the markets based on some of the characteristics of how they’re performing right now. And then we’re going to get into a Comeback Kid episode where each one of us has brought a market that was experiencing declines over the last six, 12 months, but we are expecting to take off again sometime in the near future.
So that’s our plan for today. So let’s get into our game where I’m going to ask you all to guess the market. Basically what I’m going to do is I’m going to read you three clues and at the end, each of you’re going to have a chance to guess which market this is.
For our first market, it has a median list price of $620,000. So that is well above the national average, which is about $400,000. Home values have increased 4% over pre-pandemic levels, but they have come down off their peak. And the third clue is that this city did not have a professional sports team until 2021. Kathy, you look very deep in thought, so I’m going to pick on you.
Kathy:
Sports team, new sports team. Las Vegas. That’s all I can think. Maybe. And Henry’s shaking his head no.
Dave:
That is a good guess. I’m not going to tell you that… Did they… I think… I don’t know when they got their first sports team, but it was recently. Henry, you know she’s wrong?
Henry:
No, I don’t know she’s wrong. I was nodding my head. I don’t think I was nodding it no, because I also think it’s Las Vegas. The throwing me is the average home price-
Kathy:
I know. Me too.
Henry:
620. That seems high for Las Vegas. But I’m a Raider fan and I know they just moved to Las Vegas recently and they hadn’t had a pro sports team before that. So I’m going to go Las Vegas.
Dave:
All right. James.
James:
I’m with Henry. I’m thrown off by the median home price. But then when did Las Vegas get their hockey team? That was like-
Henry:
Oh, that’s right. They had a hockey team before that.
James:
Man, I was going to agree with them until I just thought about the hockey team.
Henry:
And they also had the Las Vegas Aces. They had the WNBA team.
James:
Is it L.A? Because when did the Rams go there? No, they have tons of teams. What am I talking about?
Dave:
The Clippers, the Dodgers.
James:
I’m just throwing out Austin. I don’t even know.
Dave:
Okay. Well, James, you actually got it right. It was Austin.
James:
I was guessing more of tech cities. I was like, well, it’s Seattle like-
Henry:
But wait-
James:
Because tech’s around 600 to 700 typically.
Henry:
Wait, who’s in Austin? Who plays in Austin?
Dave:
Yeah, what professional sports team is it? I’m googling it.
Henry:
Is it like a soccer team?
Dave:
Okay. Henry, you’re right. Yes, it’s a soccer team. That’s why none of us knew it was the Austin FC, which is the first professional sports team. Shows how much we know about soccer. But that’s right. So I think this is kind of interesting. Austin. Las Vegas was a good guess, but I think the median sale price there is a lot lower.
Kathy:
Yeah, that wasn’t matching.
Dave:
But it is interesting that despite Austin’s pretty big correction that they’re in, still above pre-pandemic levels, but only 4%, which is pretty small compared to all the other… Even other markets that are in a correction right now are still up way more than 4% over pre-pandemic levels. All right, James, that was pretty impressive. Pretty impressive guess right there.
All right, well, let’s go to our second market. This one, right around the median national price. We have the median home price of $389,000. This market has seen huge job growth. 84,000 jobs have been added just since 2021. And most importantly of all, the Cuban sandwich was invented here. James, since you’re the winner?
James:
Miami?
Dave:
That’s a good guess.
James:
Wait, wait. What was the medium home price?
Dave:
389,000.
James:
Oh, that can’t be right. That can’t be right. Charlotte?
Dave:
All right. Henry?
Henry:
Yeah, obviously I’m thinking of a Florida city. Yeah, so like Fort Lauderdale.
Dave:
All right. Kathy?
Kathy:
I’m going to go with Miami just because.
Dave:
All right. The Florida theme was right. Cuban sandwiches. But it is actually Tampa, Florida. Kathy, that’s your market. Kathy, be honest. Have you ever had a Cuban sandwich when you’re in Tampa?
Kathy:
Never. No.
Dave:
That’s a shame. I’ve never been to Tampa. But let’s go and get some Cuban sandwiches,
Henry:
Aren’t you the DataDeli? How have you never had a Cuban sandwich in the home of the Cuban sandwich?
Dave:
I don’t know. This needs to be rectified immediately.
Kathy:
I don’t even remember seeing signs for one when I’m there.
Dave:
All right, so no one was there. James still has the lead. Market number three, though, median list price almost exactly the same. 389,000. One of the fastest growing cities in the entire country with a 2.8% population growth since 2022, which is huge, just for reference; it’s usually below 1% even for fast growing cities. And this city is named after an English explorer. I have no idea. Kailyn, this is a good one because no one’s going to know. All right, Henry, you’re up first.
Henry:
Come on. I don’t know. Columbus, Ohio?
Dave:
Oh, that’s pretty good. He wasn’t English, though.
Henry:
Yeah, exactly.
Dave:
All right. Kathy?
Kathy:
Mr. Dallas? I don’t know. [inaudible 00:05:56] Dallas?
Dave:
Mr. Dallas. Yes. The famous Mr. Dallas.
Henry:
The famous English explorer, Mr. Dallas.
Dave:
Yes. I remember him fondly from high school world history class. James, what do you got?
James:
I don’t know. Kensington?
Dave:
Is that even a place? Isn’t that like the ketchup, Mr. Kensington? That’s like that fancy ketchup?
James:
It sounds English.
Dave:
It does sound English. No, it is Raleigh, North Carolina, one of the fastest growing places. Wow. And it is according to Kailyn, it is named after Sir Walter Raleigh, an explorer and nobleman who funded the first expeditions to the coast of modern day North Carolina. Can’t believe you guys didn’t know that.
Kathy:
It all makes so much sense now.
Dave:
Well James, I think you won this because you were the only one who got that right.
All right, well that was fun. But we are going to get into markets that we actually know something about in the next segment. But first we’re going to take a quick break.
All right. Welcome back everyone. We are now going to jump into our comeback kid markets. Again, as we talked about at the top of the show, these are markets that have seen a correction over the last couple of months, but as the housing market, on a national basis, is starting to find its footing a little bit, I think it’s too early to call a bottom on a national level. There are definitely certain markets that are starting to see a rebound, at least for now. And we’re here to try and predict and talk about some of the markets that we think have the strongest potential to rebound throughout the rest of this year.
Henry, let’s start with you. What market do you think has the best chance of rebounding?
Henry:
Yeah, I went with Austin, Texas, which is sad that I didn’t know the answer that Austin had a professional sports team, but none of that came up in my research.
But I went with Austin mainly because I’m going to start with the end first. So the main reason I chose Austin is because the key factor in real estate is always location, right? Location, location, location. And people have been moving to, and living in, Austin because of the location, because of the amenities that it provides, because of the music life and the nightlife and the indoor/outdoor kind of living and all for essentially what can be considered a reasonable cost of living if you compare it to coastal cities or in the far east coast. And so you kind of get a little bit of lifestyle and some affordability. And so even though the pandemic caused this market to skyrocket and then now fall back to reality a little bit, the lifestyle there is still the same and people still want to enjoy those amenities.
So I think as the market moves closer to where it was pre-pandemic, it’s going to just encourage more people to go there. When I say people, I don’t just mean people. I also mean businesses. People work at businesses. Businesses want to be able to enjoy these amenities when they’re not at work. And so they move. There’s several companies who have either relocated or opened up offices in the Austin, Texas area. You’ve got Oracle moved their headquarters from California to Austin and they did that in 2020. BAE Systems moved their office. They’re a defense contractor, essentially. They moved their offices to Austin in 2021. HP. Everybody knows who HP is. They moved headquarters from California to Spring, Texas, which is just outside of Austin. So these are big employers that employed lots of people across a couple different industries. And it’s cheaper for them, I’m sure, than what it costs them to office and have headquarters in California and other cities. And so that’s bringing people because people work there. And as those companies continue to grow, more people work there.
Some stats that I did find interesting: population growth has gone up year over year since 2020. So it went up about 3% in from 2020 to ’21, 2.79% from ’21 to ’22, and then 2.39% from ’22 to ’23.
Dave:
That’s got to be like one of the fastest growing markets in the country.
Henry:
It is. It is the fourth fastest growing city in the US. And it ranks number one in growth rate among cities with over a million people. So it rapidly growing.
And the median home price, if you look at home values in 2021, average price was 451. In ’22 it was 567. So it jumped 26%. And now in ’23 it’s 530,000. So it’s down 15% from last year, but it’s still up from the 451 from pre[pandemic levels levels, going back to what we talked about in the last segment with Austin.
And so I think it’s a comeback city because the location is still phenomenal. The cost of living, when compared to other cities, is still fantastic. Companies are moving here, which is bringing jobs. People can still work remote in a lot of companies, so they’re wanting to move places where they would enjoy the lifestyle. And I just think that’s going to cause this place to continue to boom as the market softens.
Kathy:
Yeah. And with all those tech companies moving from California, that’s one big reason that people are moving there. But it’s really the tagline of Austin is why Californians are moving there. Keep Austin weird, right? Yeah. So we’re going to do that as Californians as we move out there. We’ll just keep it weird.
Henry:
California said, hold my beer. We got you.
James:
Henry, I love this pick because I’m a firm believer that the tech cities are going to all make comebacks right now. I think the pandemic got… Everything changed so much during that time where people could work remote. They were moving around. These tech companies have been very clear they want people back in the office and things are getting back to normal. And these are where all the jobs are right now. There’s massive growth in all these cities. There’s lots of job openings across the board. Income is rising.
The only thing I would say about Austin as a whole is it’s a very large geographical area. I don’t know if the outskirts are going to do… Randomly, the guy that won me at the BP Con was from Austin, Texas. He’s a flipper out there. He texted me last night and he said his inventory’s stacking up everywhere on the outskirts. And so that would be the only thing that would maybe hold that city back a little bit is just the sheer size of it. And there’s so many different income pockets in that size that it could skew the math a little bit. But I think the core city where the jobs are will be growing pretty strong.
Dave:
The only other thing I’d add… I agree; I think Austin has one of the best long-term potentials of any city in the country, if not the single best. And if prices are coming down, it could be a good opportunity to buy.
The thing I would caution against is Austin is one of the most overbuilt cities in terms of multifamily specifically. And that could create some competition and some stagnation of rent growth even in single families in the short term just because there’s a lot of supply coming online in Seattle. And that is also – spoiler – true of the city that I am going to present. This naturally happens.
Henry, this is a great pick, but you’re not the only person who sees Austin as a great long-term buy. So builders see that and they start buying and building like crazy. And when we enter a correction like this, it’s looking like it’s poorly timed. So that might play out in Austin, at least over the next couple of months.
All right. Well, great pick. Kathy, what about you? Where are you expecting a big comeback?
Kathy:
Well, it’s so funny. Just one comment on Austin. This is an example of why sometimes cashflow shouldn’t always be the thing to focus on. Because I remember, I’ve been doing this a long time, but 15 years ago I would always say, ah, I’m not going to buy an Austin because it just doesn’t cashflow. And back then the average price there was, I don’t know, 200,000 or something. I’m like, it just doesn’t cash flow. Henry, what’d you say the medium price is now?
Henry:
The medium price of 2023 is 530,000.
Kathy:
Yeah. So it’s one of those examples of sometimes when you see all those factors in play, maybe it’s okay to break even. Maybe it’s okay to just hold that property knowing that there’s going to be so much growth.
And that is how I feel about the market I’m going to present. We have a development nearby, as you guys know, but Salt Lake City is the market that I’m focused on. It’s getting hit a little bit hard right now. There is increased inventory for sure, but those fundamentals are there, like I saw in Austin many years ago. What’s happening in Salt Lake is really massive population growth. And the factors that I follow, I know you guys do do too, is number one is population growth. I want to know that people are moving there and want to be there and aren’t leaving. And usually population growth comes from job growth. People move where the jobs are. And when you can still get affordable properties in those markets, to me, one of those places where you just sit and wait it out. And even if the cash flow is not great, when you have just massive population and job growth, you’re probably going to be okay in the end.
So what’s happening in Salt Lake is the population has increased 161% over the past 10 years. And the fertility rate is 3.4. Nationwide, it’s 1.8 to 2. So lots of baby boom in Salt Lake. Of course, that probably has a lot to do with the Mormon population there where families do marry… They’re formed very young and of course have a lot of kids. So we’re just seeing outstanding population growth there.
Jobless rate is 2.2%; lowest in the country, 43,000 new jobs. Zillow forecast growth of 1.4% next year. So these are just some of the basic reasons why I’m bullish on Salt Lake. And of course we do see a lot of tech companies moving there as well to the Silicon Slopes as they call it.
Dave:
Well, I was going to agree with you, Kathy, but if Zillow is forecasting growth, that probably means it’s going to decline.
Kathy:
I think it’s wrong in the sense that it’s going to be higher than that, honestly. Because it already is. It’s already showing that it’s coming back. It’s a comeback city. One of the things… This is a cool slide on the youngest cities. And you know what? Seattle is number one, Denver second, but Salt Lake’s on that list too of the median age being five years younger than the national average.
Dave:
Oh wow. Well, if I was giving up points for this presentation, I would give you some points for bringing in fertility rate. I think that’s a new data point on this show. I don’t think we’ve ever had that, but it totally makes sense. It’s a good one. James, Henry, what do you guys think?
Henry:
I think she gets points with the fertility rate and loses points on the Zestimate.
Kathy:
Fair. I’ll take it. When they change their forecast, I don’t know, five times or something. I want to do that. I want to forecast and then just change it every month.
Henry:
I mean, that’s what forecasting is, right?
Kathy:
That’s true.
Dave:
Yeah, it is. That is exactly what it is. It’s better than just pretending that something that you already know is wrong is still-
Kathy:
It’s still right. Yeah.
Dave:
Yeah. So I think updating the forecast is still a good idea.
Kathy:
It’s fair. The world changes so quickly.
James:
Yeah, I love Salt Lake City. I’ve been there a few times and the quality of living’s really good there. You can just tell as you go around, everything’s clean. There’s good infrastructure there. I don’t know a whole lot about the job growth and economy there. But I kind of foresee that being more of a stable market than seeing it kind of hockey stick back up. I think there’ll be more steady growth. I think these other secondary cities are going to be more going into the steady, stable growth and they’re going to fall behind these tech cities with the comeback. But I do think they’re good quality living. There’s a lot of people living there. Shoot, I tried to go skiing at Kathy’s… We stayed at Kathy’s development and we tried to go skiing. There were so many people, I had to turn around and leave. I was like, this is unreal.
Kathy:
It was packed.
James:
It was packed. So there definitely is a lot of bodies there.
Henry:
I think the outdoor lifestyle is going to draw lots of tourism, which brings money in that supports that community that and the people don’t stay. So I think that’s going to help. My concern is long term job growth. So if they’re having such a baby boom and there’s going to be so many people, if they don’t continue to have increasing job growth, then where are all these people going to work and how are they going to continue to produce for their families?
Dave:
All right. Well, I like it. James, what about you? Are you on the Austin/Salt Lake bandwagon or you got something else?
James:
I like Austin. I like the tech cities on the comeback. I feel like they got overcorrected a little bit during those rate hikes. But I’m a repping my backyard, Seattle, Washington. I think that is going to be the biggest comeback kid market and mostly because I’m living in it right now and it just feels different. We put a house up for sale on Friday, had four offers in three hours on it, and we were at the top end of the pricing. And what I’m seeing is if you have a good product in a good neighborhood, that stuff is selling and it’s selling for above list. Things trading below list now in this market is not happening. And who knows, we might be seeing a seasonal change.
The main reason like Seattle is the population is growing. We have so many jobs. People can get good paying jobs. There’s no income tax in this state. And so people can… They get to save more. They get to walk with more in our state, and that’s a big benefit. But Seattle’s population increased 2.4% from 2021 to 2022, and they’re anticipating the same growth. That is the fastest growing city in 2022.
So there’s growth and the companies are also growing rapidly as well. Like we’re watching Amazon, Facebook, Microsoft, expand out their campuses. Microsoft’s building out a campus that’s being built over a 10 year period; that’s how big it is. And they’re ready to fill these places up with bodies, which means good paying jobs are going to be in our market.
Home values, what we’ve seen is we’ve seen this hockey stick back up. This is really interesting. So we saw the median home price drop down in December to 754,000. That was a huge drop from the previous 12 months. But recently we are now sitting, since December, we’re at 840,000. We’re seeing this swing back up and I’m seeing it in real time data.
We were comping a property in Bellevue yesterday and Bellevue, Washington’s a nice suburb city right outside Seattle. Properties that we’re selling for 850, 90 days ago are now selling for 1.15 to 1.2 in the exact same condition. And we’re seeing this rapid growth. There’s very, very little inventory. Our inventory went up to about two and a half, almost three months. We’re back down to under a month worth of inventory. And so things are getting consumed and there’s a lot of buyers in the market. So any market that has that much pent up buyer demand with no inventory, regardless of rates, there’s transactions going down.
And the transactions are trending up, not trending the other way. And I think that comes down to a lot of these tech cities. They’re smart buyers. They like to overthink things. And when these rates spiked up, they all went on the sidelines for a minute. They saw it kind of come down and then they saw it stabilize out and now they’re having massive FOMO and they’re jumping in. And as they’re jumping in, values are going up.
Rents are also still climbing. There’s massive rent growth the last two years; I think it was 23% rent growth over the last 24 months. And we’re still seeing it grow. It’s growing at a more stable pace, but we have not seen the decline like Austin saw. It grew at 2.7% in the last 60 days on rent growth. We saw a little bit of a dip for that last quarter in ’22, but not much and now it’s growing it as the cost of housing is going up, with the interest rates and the monthly expenses, so is rent. So rent is getting pulled up as well.
So all the key indicators are showing that it’s rebounding really well and things are increasing. And not only are the values increasing, the wages are increasing. Wages are up 5% year over year. So there’s a lot of jobs in the market. 119,000 open jobs, people are getting paid more and there’s no inventory. And so the people with jobs want to settle in. And that’s what we’re seeing is the market is rebounding pretty consistently.
Kathy:
That is so shocking. Really, that people can buy those high priced homes with today’s interest rates and that they’re not the shortage of them. Are they paying cash? I mean, who are these people?
James:
They’re financing the deals. That’s the thing. There’s a lot of financing. And we’re also down in SoCal and the competition, I know, that is growing too right now. Like Newport Beach is accelerating still. That’s cash buyers. I’m seeing it. People are stroking big checks for houses. This is, they’re financed tech buyers that are putting about 25% down. They’re your standard buyer. And I was a little shocked too because if you really think about what the average tech workers making, around a hundred grand a year, and the housing cost is pretty expensive. People are paying five, six, $7,000 for these houses in these neighborhoods. It does surprise me, but they are transacting. I think there is also still a lot of cash that is sitting in people’s banks right now and they’re just utilizing it. There was so much cash printed, people made so much money the last 24 months. Now they’re just putting it to work.
Kathy:
I mean, I was just under the impression that they were feeling depleted after the stock market went down and they lost their money in crypto and so forth. But if some of these people are from California and they’re buying a million dollar house, they may be leaving a 2 million house or a 3 million house. And so perhaps it is more affordable for them from that perspective. But if they’re not, if they’re just locals, it’s still, like you said, if they’re making a hundred thousand maybe per person and it’s a couple, it still seems like a stretch. But it’s amazing.
Dave:
I think the other really interesting thing about Seattle, and honestly a lot of these markets, is that the tech, we’ve seen a lot of high profile tech layoffs, and I think that perhaps led to some fear, particularly over the winter. People were sort of waiting to see what happened. But from some of the data… I mean, we see the labor market data, which is pretty darn strong given where we are in the tightening cycle. But I was reading something the other day about how ChatGPT has all of these major companies like Microsoft, Google, all of them in this arms race again now, and they’re staffing up again. They’re all trying to hire quickly to try and get the best AI engineers and be able to beat each other to the market. So it’ll be really interesting to see if the very well publicized layoffs in tech slow down and we start to see these tech markets start to take off again.
Henry:
You talk about the stock market. The stock market’s been kind of rebounding over the past couple of weeks. I know my portfolio’s looking better than it has in a long time. And so I think people are starting to see some of that positivity. I think if the interest rate hikes slow down, stop, or reverse, I think you’re going to see a boom in these markets, especially one like Seattle with such great fundamentals. Because you’ve got the jobs, you’ve got the job growth. It’s a place where people want to live. It’s desirability. I don’t like rain a lot, so I don’t want to live there, but lots of people enjoy that part of the country.
I think if you’re waiting on the sidelines or you’re looking for a place to invest, thinking about a place that has these strong market dynamics and fundamentals, I think it’s such a sweet spot right now because the rates haven’t completely changed direction yet. And I think once they do, it’s going to create this big bump or demand. And so there’s this sweet spot where you can get in right now, especially if you can buy at somewhat of a discount. And then even if that property, like Kathy said, breaks even, when you’re buying in a market with these great fundamentals, you know it’s a waiting game. And if you can hold that property long term… You may not even have to hold it that long depending on what happens with rates. But if you can hold that property long term, I think you’re playing the market conditions safely.
Kathy:
I do want to share one last thing that Marcus and Millichap Research Services came out with the employment pre-pandemic percent change. So which cities have more jobs now than pre-pandemic? And interestingly enough, Austin came number one with 14% more jobs now than before the pandemic. Dallas was second with 9.9 and Salt Lake was third with 9% more jobs than pre-pandemic. And Seattle’s not on the list, but maybe that’s because Seattle already had so many jobs that… I don’t know, but I think that’s interesting.
James:
You just made my hand sweaty, Kathy.
Kathy:
But I mean there were already so many jobs up there that and just obviously not enough real estate for all the jobs that are there.
Dave:
All right. Well, for our last market… I guess this is a theme; I picked one that’s sort of in line with what the three of you have already picked. It is the home, if you know these places, home of Qdoba, Chipotle, all sorts of other fast food restaurants. And that is of course, Denver, Colorado where I am just like James and I’m just a homer, picking the market I know best.
But I really believe that Denver, like these other cities, is poised for really big comeback for some of the same reasons we’ve been talking about, is really strong fundamentals. The population growth has been very strong for 15 years. Prices have dropped a little bit, so they’ve become a little bit more affordable, but it is heating up really quickly. Days on market in Denver have dropped down to just 11 days right now. Yeah, so we’re seeing a lot of activity.
And actually, I texted my real estate agent to just ask him, is the data we’re seeing real? And he said that just this week he had two clients that both offered 70,000 over asking with an appraisal gap and did not win either of them. So that’s a 15% over asking and they’re not winning. So I don’t know if this means that the bidding wars and crazy appreciation is coming back, but just shows what happens in a market with strong fundamentals when there’s no supply. People still want to live there. And so I think Denver, especially after the Nuggets winning the NBA championship the other day-
Henry:
Oh, slid that one in there.
Dave:
Absolutely. Because we have actual, real professional sports teams in Denver. Unlike Austin.
James:
The Nuggets just crushed that playoffs.
Dave:
Yeah, they’re amazing. I unfortunately couldn’t watch because game five was on at 2:30 in the morning. It started at 2:30 in the morning.
Henry:
So you’re not that diehard of a fan?
Dave:
No, no. I’m more of a Knicks fan and they’re just terrible.
Kathy:
They’re going to have to change their name from Nuggets to Boulders or something. They’re playing big time.
Dave:
I think people like the Nuggets name for a few reasons.
Henry:
Okay, I get it. I get it.
Dave:
All right. Well, what do you guys make of this? I mean, I think we all sort of picked similar things. We did not plan this out, but it seems like we’re all sort of aligned that these big cities, they’ve seen a correction and they are starting to come back. Is that the general sentiment? Do you think other markets are starting to come back? Were there any others you’re considering?
Kathy:
I mean, these three cities, we said Austin, Salt Lake and Seattle are big tech cities, and anyone who thought that tech was dead because there were layoffs is just not realizing the next 10 years is going to be so tech heavy. The changes that are coming. I mean, we’re just at the beginning of technology ruling our lives, of controlling the world. It’s coming and it’s going to be massive. And I think you’re just not going to go wrong in a tech city.
James:
I agree with Kathy. I think that’s just where the jobs and the potential are. That’s why they have such booms in general. But ones that boom also settle down. And I think the other big cities that did boom, like Phoenix, Vegas, are going to not have the same rebound because just the jobs aren’t there. But the tech makes a big driver.
The biggest surprising thing I’ve heard though today was actually when Dave was talking about… I didn’t know Denver’s the home of fast food because everybody is so fit in Denver. I’m shocked. It’s just the home of beer and fast food and people are still fit there.
Dave:
Well, I should say fast casual. We’re not [inaudible 00:31:05] McDonald’s. But honestly, it’s crazy how many of them there are. It’s like Qdoba, Chipotle, Quizno’s, Smashburger, they’re all started there.
Henry:
Why would you be surprised that Denver is the home of the places where you want to get munchies?
Dave:
Okay, Henry. All right, this started-
Kathy:
Well played.
Dave:
… well before the law in question.
Henry:
No, we need burritos, guys. We need a lot of burritos.
In all seriousness, I think a lot of this goes back to some of the things we’ve talked about for a long time on this show. I remember when rates were spiking. We did a show where we had a conversation where we essentially were saying, at some point these high rates just become normal. And when life normalizes, people don’t just move because of financial decisions, they move because they want to. They move because of life changes. They move because of job changes. And life will continue to happen. And the more comfortable people are with the market dynamics, the more they’re going to jump in. I think what’s been holding people back is the level of uncomfortability or uncertainty that’s out there. But if people start to feel more comfortable even with the volatility, or more comfortable even with the higher rates, you’re going to see more buyers enter the market. And I think that’s just going to help a lot of markets start to rebound a little bit. Obviously the ones with the better market dynamics will rebound harder.
Dave:
Well said. Well, what a good way to get out of here. Thank you all for doing all this homework and bringing these shows. This was a lot of fun for Henry, James and Kathy. I’m Dave Meyer. Thank you all so much for listening. See you next time for On The Market.
On The Market is created by me, Dave Meyer and Kailyn Bennett, produced by Kailyn Bennett, editing by Joel Esparza and Onyx Media, research by Puja Gendal, copywriting by Nate Weintraub. And a very special thanks to the entire BiggerPockets team. The content on the show On the Market are opinions only. All listeners should independently verify data points, opinions, and investment strategies.
Interested in learning more about today’s sponsors or becoming a BiggerPockets partner yourself? Email [email protected].
Note By BiggerPockets: These are opinions written by the author and do not necessarily represent the opinions of BiggerPockets.
Source link
Housing Market Tracker: Inventory gets summer lift
Summer is here, and housing inventory is finally growing! The spring housing inventory was like a zombie rising from the grave, very slow, but the summer is showing some promise and let’s hope it continues. Purchase apps had a small week-to-week gain. Mortgage rates were again in a small range, hanging near 7%.
Here’s a quick rundown of the last week:
Weekly housing inventory
The active listings data saw decent growth last week, less than I would like to see, but growth nonetheless. I would feel much better about the inventory situation if we added an additional 3,000-8,000 houses to the weekly data line from current levels. However, the real positive story here is that even with new listing data trending at an all-time low, we are getting the growth in active listings we traditionally see in the spring and summer.
As you can see in the chart below, the inventory growth has been slow this year, and we will have negative year-over-year weekly active inventory data very soon. But, last year saw the biggest home sales crash ever recorded in history, so the rise in inventory last year happened because of an abnormal event and we were working from a very low bar. So, it shouldn’t be a shock that as soon as housing demand just stabilized, we ran into some negative year-over-year data.
In addition, new listing data turned negative year over year after the second half of 2022. The affordability hit with higher mortgage rates has impacted new listings data since most sellers are buyers, thus facilitating an all-time low in new listings data. Also, we must remember that even in 2021, when we had 3% mortgage rates, new listing data was trending at all-time lows.
New listings data has had three weeks in a row of negative weekly data, nothing big, of course, but we are starting to get into the seasonal decline period of this data line. This is something to focus on over the next four to six weeks. The data shows a noticeable decline year over year, and 2021/2022 were already working from all-time lows.
Compare the new listings data this week to that in recent years:
Last week, NAR released the existing home sales report, which showed a slight monthly growth in sales. More importantly, it showed that the days on market dropped back to the teenager level, which means we are once again in a savagely unhealthy housing market. Nothing good is happening in housing when days on market are so low. Also, NAR updated its inventory report showing a year-over-year decline in inventory.
NAR total Inventory levels:
People often ask me why there is such a difference between the NAR data versus the Altos Research inventory data. This link explains the difference and is worth a read.
The 10-year yield and mortgage rates
The bond and mortgage rate world has been calm the last two weeks. Considering all the data and Federal Reserve talk we have had recently, it’s surprising how stable rates have been. The 10-year yield had a small range last week, and mortgage rates stayed in a range between 6.875%-6.95%.
In my 2023 forecast, I wrote that if the economy stays firm, the 10-year yield range should be between 3.21% and 4.25%, equating to mortgage rates between 5.75% and 7.25%. As long as jobless claims trend below 323,000 on the four-week moving average, the labor market stays firm, which means the economy remains healthy. Jobless claims have stayed below this range all year so far and job openings are still at 10 million.
I have also stressed that the 10-year level between 3.37% and 3.42% would be hard to break lower. I call it the Gandalf line in the sand: “You shall not pass.” As you can see in the chart below, we have tested this line many times, and yet the 10-year yield could not pass. The setup for the 10-year yield to stay in the range is intact. Unless the U.S. dollar explodes higher or we get some market stress overseas, we should remain in the forecast range.
The counter to my 10-year yield range would be if the economy here or around the world starts to accelerate higher; that would be a valid premise to get the 10-year yield above 4.25%.
The issue in 2023 is more than the 10-year yield; since the banking crisis started, the spreads between the 10-year yields and 30-year mortgage rates have gotten worse, and until the Fed cries uncle, it doesn’t look like we will see any more improvement.
Another aspect of my 2023 forecast is that if jobless claims break over 323,000 on the four-week moving average, the 10-year yield could break under 3.21% and head toward 2.73%. Last week we didn’t have much movement here with jobless claims, but we have seen the labor market get looser since the lows in 2022.
From the St. Louis Fed: Initial claims for unemployment insurance benefits were little changed in the week ended June 17, at 264,000. The four-week moving average increased to 255,750
Purchase application data
Purchase application data has surprised people with back-to-back positive prints in the last two weeks of 8% and 2%, which means year to date, we have had 12 positive prints versus 11 negative prints. There is no clear direction on demand on the week-to-week data. However, the fact that this is happening is a huge deal, as you can see in the chart below. If this hadn’t happened, all of us would be having a different conversation today about the housing market and inventory.

Since Nov. 9, 2022, we have had 19 positive and 11 negative prints, which shows that demand has stabilized. Now that we are almost to July 4, you can clearly see it in the existing home sales data, as purchase apps are a forward-looking indicator.
Home sales can still trend below 4 million this year if we see more weakness in purchase application data, but the sales decline is much slower this year. This is significant because the market is acting normally again with these low sales levels. This gives everyone a better perspective of where demand is going, as last year’s waterfall collapse was a historic event.
The week ahead: Housing data and PCE inflation
We will have a big week ahead in data. The S&P CoreLogic Case Shiller home price index and the FHFA home price index will come out this week and they will show the firming up the month-to-month price data compared to what we had in the second half of 2022. Also, the new home sales report is coming up, and we will see how much progress we have made.
Pending home sales will be out next week. I don’t expect much to happen there; in fact, we could have a negative report as we did have four straight weeks of negative purchase application data recently.
Also, the PCE inflation data will be released Friday — this is where the Fed wants the inflation growth rate to go back down to 2%. I know people love to focus on CPI inflation data, but the PCE data matters more. Below is a look a Core PCE data, which the Fed wants to see go much lower.
So, we have a busy week of data, and of course, we always keep an eye out on jobless claims data every Thursday. However, four housing reports and inflation data with some Fed talk make for an exciting week for bond yields and mortgage rates. Also, we never know what we will get from Russia, with love or without.
Source link
Affordable housing, homelessness bills reintroduced by Rep. Waters
Rep. Maxine Waters (D-Calif.), the ranking member of the U.S. House of Representatives Financial Services Committee, reintroduced this week three pieces of proposed legislation to bolster affordable housing investments, expand the housing choice voucher program and provide billions of dollars in assistance for first-time, first-generation homebuyers.
“Together, these bills represent the single largest and most comprehensive investment in affordable housing in U.S. history and comes at a time when our nation’s housing and homelessness crisis has reached its worst state,” Rep. Waters’ office said in a statement. “Today, U.S. home prices have skyrocketed by nearly 40% since 2020, over 582,500 people are living without a home, and first-time homeownership has reached its lowest level on record.”
If passed, the “Housing Crisis Response Act of 2023” would provide more than $150 billion in affordable housing investments, representing “the single largest investment in affordable housing in our nation’s history,” according to an announcement.
Waters’ office estimates that the associated funds would create 1.4 million affordable and accessible homes, provide rental assistance for up to 300,000 households, and create “the first-ever national investment in homeownership for first-time, first-generation homebuyers.”
The “Ending Homelessness Act of 2023” would transition the Housing Choice Voucher program into a federal entitlement, which would greatly expand access to the program. The bill would also ban housing discrimination based on source of income and veteran status.
And, the “Downpayment Toward Equity Act of 2023” would provide $100 billion in assistance to first-time, first-generation homebuyers purchasing their first home. Waters’ office contends that this will address the nation’s racial and homeownership gap.
“This would include assistance for down payments, closing costs, and to help buy down mortgage interest rates,” Waters’ office said.
The bills all have the same group of legislative cosponsors in the House, all of which are Democrats. These legislation previously passed the House in the prior Congress as part of the sweeping “Build Back Better” agenda from the Biden administration. However, it ultimately failed in the Senate.
The bills do not appear to have any Republican support at this time. While the majority in the House is slim, Republicans control the chamber and determine the pieces of legislation that are ultimately brought for debate and voting.
Source link
How to Choose a Multifamily Realtor
Multifamily properties are among the most common types of housing that investors rely on to grow their portfolios. They provide consistent and reliable income, have relatively low vacancy risk, and typically appreciate over time.
Working with a multifamily real estate agent is smart if you are considering investing in this type of property. These professionals can help you find what you are looking for in less time and possibly help you save money during the negotiations.
Why Do I Need a Multifamily Realtor?
Not all real estate agents are experts in all property types. Some specialize in helping families find their forever homes, while others may specialize in selling homes. Agents who specialize in multifamily properties are investing experts. Some may even be involved in multifamily real estate investing themselves.
Working with an agent specializing in multifamily properties has several important benefits. First, a good agent will help you save time by narrowing your search to the properties that are good investments. Your agent will review all the multifamily home listings, determine which properties meet your criteria, and find the net operating income, rental history, financial projections, and other important information.
A multifamily property agent will also be an expert in the local market and will have connections with property owners, developers, and other investors. Your agent may also know of off-market multifamily properties that will soon be for sale, giving you a competitive advantage over other investors. An agent may also know which local property managers have the best reputations.
A good multifamily agent will also schedule tours and accompany you when you visit properties. The agent will know which questions to ask to help you make an informed buying decision. The agent will also help you conduct a thorough property analysis and evaluate investment risks and potential returns.
One of the greatest benefits of using a multifamily property real estate agent is that it could help you save money. Your agent will help you draft an offer and work on your behalf to ensure you get the best deal possible. Your agent will also arrange inspections and assist with paperwork to ensure a smooth transaction.
Understanding the Different Types of Multifamily Properties
There are several different approaches you can take with multifamily real estate investing. The best approach for you will depend on your investing experience, risk tolerance, and how quickly you want to grow your investment portfolio.
There are three types of multifamily properties, and it’s important to carefully consider the pros and cons of each type before making an investment decision.
Apartment complexes
When people think of multifamily properties, apartment complexes are often the first things that come to mind. Apartments typically have strong demand and are commonly rented by college students as starter housing, by those looking for temporary housing, and many others. Apartment complexes typically consist of two or more buildings with multiple units.
The primary advantage of this type of property is occupancy diversification. With single-family homes, for example, you won’t earn any money from a property that’s not rented. The monthly note will still be due; you may have to pay it out of pocket until you find a tenant. On the other hand, a single vacancy in an apartment complex with dozens of units may not be as financially disruptive and could help you maximize your cap rate.
An important negative of apartment building complexes for investors is that they cost significantly more than other properties, like single-family homes. You can use creative financing strategies to finance apartment building complexes, but many new investors may be intimidated by such a large investment and the ongoing maintenance requirements.
Turnkey properties
A turnkey property is any rental property that has been recently remodeled and doesn’t need any additional updating or repairs. It could be single-family homes, apartments, or something else. These properties will also have existing tenants and may be managed by a property management company. As the name implies, the property is “turnkey” for an investor.
The primary advantage of investing in a turnkey property is that the rental income begins immediately after the closing. Although all rental properties will require ongoing maintenance, major issues will most likely have been identified and repaired. The property will also not need any immediate cosmetic improvements, which is an important consideration for long-term investors.
An important negative of turnkey properties is that they may sell for a premium over other properties. They are usually sold by investors who purchased them to fix and flip for a profit. However, turnkey properties may still be great options for those who work full-time jobs and want to break into real estate investing.
Duplexes, triplexes, and fourplexes
A duplex, triplex, or fourplex is a multifamily property with 2-4 units in a single building. Duplexes have two rental units, triplexes have three, and fourplexes have four.
Many people prefer these properties because it allows them to grow their investment portfolios one property at a time, which minimizes risk. They are also ideal for those who are new to real estate investing. Instead of purchasing a large multifamily property with dozens of units, a new investor could purchase a duplex and then consider buying another one after gaining experience and confidence.
An important disadvantage of this property type is that you may end up with multiple properties that are not close to each other. Driving from one property to another to address maintenance issues or show units to prospective tenants could be inconvenient.
Do Your Research: Learn About the Neighborhoods and Choose a Location
Where you purchase multifamily units is one of the most important decisions you will make. Before you choose a property, it’s important to ensure there is a high demand for rental housing in the area and that your investment will appreciate over time.
First, it’s important to consider local demographic data and the local economy. You can use online resources to find crime rates, school ratings, and the unemployment rate, which will help you determine whether the community you are considering is one you want to invest in.
Next, visiting the community you are considering to see it in person is a good idea. Check out the local amenities to ensure they are close to the property you are considering. Also, don’t forget to explore the surrounding area to get a feel for it and to make sure it’s family-friendly.
When you visit a community, take the time to talk to some of the locals. Tell them you are considering buying property in the area and ask them if they like living there. They may give you important information you won’t get by researching online or from other sources.
Finally, you will also want to assess the local rental market by analyzing the rental demand, vacancy rates, and rent appreciation trends. It’s also important to find out if there are any planned infrastructure projects or new business developments. A new distribution warehouse or factory employing many people could dramatically increase the demand for local rentals, allowing you to increase your rates and maximize your cap rate.
How Do I Find a Good Multifamily Realtor?
Before buying a multifamily property, finding the right agent is important. The person you select will help you find the best investment property for your needs and ensure a smooth transaction. Multifamily agents are not difficult to find, and there are some simple strategies you can use to help you narrow your search.
The first thing you can do is to ask for referrals from other real estate agents. Be sure they know you are specifically looking for someone specializing in multifamily properties. After getting some recommendations, you can check out any reviews and ratings they may have received from others on online real estate platforms.
The next step is to talk to each of the agents you identified to make sure you are compatible and that they understand your investing goals. You could talk to them or arrange a short in-person meeting. Because you will be working closely with your agent, you want to make sure you are comfortable communicating with the person you select.
What Characteristics to Look for in a Multifamily Realtor?
Any real estate agent you consider should be a multifamily housing expert. Before selecting an agent, there are three important characteristics to ensure you get someone who knows the market and your investing needs.
They must be area hyper-local experts
When considering agents, ask them about their experience with multifamily investing, their track record of successful client transactions, and their knowledge of the local markets. A good agent can tell you which communities have the strongest rental demand, the best economies, and a positive long-term outlook.
They need to be qualified experts in multifamily properties
It’s also important to consider professional certifications before selecting an agent. Be sure to look for a multifamily investment property certification such as the Certified Commercial Investment Member (CCIM). This will help ensure that the agent you choose keeps up with industry changes and is committed to professional development.
They have to be trustworthy enough to care about your investment criteria
Some agents will have more experience than others. Reviewing their track records and experience will help you avoid agents who are new to multifamily property investing, work as part-time agents, or are generalists who deal with commercial real estate in addition to other property types.
FAQs
Before you select an agent, it’s important to ask the right questions to determine if an agent has the experience, connections, and expertise you need.
What questions should you ask your multifamily real estate agent?
Talking to several real estate agents specializing in the multifamily market is a great way to find someone easy to communicate with and knowledgeable about the local market. Here are some important questions to help you determine if you and an agent are a good fit.
What is a normal commission for a multifamily real estate agent?
As a rule of thumb, commissions for multifamily real estate agents are typically 4-6% of the sale price and will vary depending on different factors. For a large real estate investment, the commission may be negotiable. It’s another important question to ask when you are considering agents. Factors that may contribute to an agent’s commission include the location of the property and its market value, the agent’s experience, and the level of service provided.
The Bottom Line
If you consider investing in multifamily properties, ensuring you work with the best agent isn’t optional. The person you choose will be a valued business partner who looks out for your interests. Your agent will work closely with you to find the right property, select the right loan type, negotiate the best deal, and do other things to ensure a smooth buying process.
Thankfully, finding your ideal multifamily real estate agent has never been easier when you use BiggerPockets’ Agent Finder. With the easy-to-use tool, you simply enter the city or zip code you are considering and your investment criteria. You will then be matched with a local agent who can help you find the best investment property for your needs.
Find an Agent in Minutes
Match with an investor-friendly agent who can help you find, analyze, and close your next deal.
Note By BiggerPockets: These are opinions written by the author and do not necessarily represent the opinions of BiggerPockets.
Source link
The savagely unhealthy housing market is back
The days on market are back to a teenager level in the existing home sales market, which means I can officially say we are back to a savagely unhealthy housing market! Just when I thought I was out, they pull me back in.
What do I mean by savagely unhealthy?
One of the critical data lines I track is the days on market, and when that breaks under 30 days it’s a dangerous sign, but when we get into the teenager level or lower, it’s a red alert. Nothing good happens in the housing market when the days on market are at a teenager level or lower. You either have a massive credit boom that will eventually lead to a bust, or you have too many people chasing too few homes. This is what leads to a savagely unhealthy housing market.
I first used the term savagely unhealthy in March of 2022 because we had solid demand while inventory was at all-time lows. Credit channels and inventory channels both changed after 2010 because of the qualified mortgage laws and the 2005 bankruptcy reform laws. This means you will see less financially stressed homeowners needing to sell their homes before a job-loss recession. This kind of activity was happening years before the job-loss recession happened in 2008.
Homeowners were in excellent shape before COVID-19 hit us, and they got better after refinancing their most significant debt to a lower payment. Also, their wages are rising faster in an inflationary period. I feared that housing inventory levels could stay abnormally low for longer, leading to unhealthy home-price growth and that’s what happened in the years 2020-2023.
Massive home-price gains aren’t good, especially when they happen quickly. Once mortgage rates rise in this environment, it can lead to big-time demand destruction, which is what has happened.
Existing home sales are near 21st-century lows, but even with that reality, as the chart below shows, we are still at teenager levels for the days on market.
From NAR: Total existing-home sales– completed transactions that include single-family homes, townhomes, condominiums and co-ops – rose 0.2% from April to a seasonally adjusted annual rate of 4.30 million in May. Year-over-year, sales dropped 20.4% (down from 5.40 million in May 2022).
Home sales came in better than I thought this month, as I was looking for a decline month to month. We had a giant sales print three months ago, which I believe will be the sales peak this year. So far, that call has been right because I don’t think mortgage rates can get low enough to boost demand higher from that print.
NAR Research: Total existing-home sales rose 0.2% from April to a seasonally adjusted annual rate of 4.30 million in May.

For the rest of the year, we want to play the edges of the sales range. The sales range should be between 4 million to 4.6 million, the same range I talked about after the giant sales print that took us to 4,550,000. Demand is undoubtedly weakening if we trend below 4 million but trending above 4.6 million would mean much better mortgage demand.
I don’t see anything in the data to get us over 4.6 million with duration unless mortgage rates fall much lower than where they are currently. There is a better case that we can get below 4 million if mortgage rates stay high and new listing data starts its seasonal decline in the data.
Now for the savagely unhealthy part of the report.
NAR Research: First-time buyers were responsible for 28% of sales in May; Individual investors purchased 15% of homes; All-cash sales accounted for 25% of transactions; Distressed sales represented 2% of sales; Properties typically remained on the market for 18 days.

We are close to the 2022 levels for days on the market, not because demand is booming but because it has stabilized. As the year progressed into the second half of 2022, housing demand worsened, and the days on the market grew above 30 days, meaning it was no longer a savagely unhealthy housing market.
However, as demand has stabilized, the days on the market have decreased.
Not much can be done here, mortgage rates are near 7%, and people aren’t selling. So when demand stabilizes, it can bring down the days on the market. The cash buyer percentage is the same year over year and roughly everything in this survey isn’t too far off 2022 levels.
From NAR: Total housing inventory registered at the end of May was 1.08 million units, up 3.8% from April but down 6.1% from one year ago (1.15 million). Unsold inventory sits at a 3.0-month supply at the current sales pace, up from 2.9 months in April and 2.6 months in May 2022.
Yes, housing inventory is down year over year. While inventory grew month to month, this year has been the walking dead on the spring inventory data, so the growth has been so bad that we had a negative year-over-year print in June! I can’t stress enough how bad that is, something I talked about on CNBC a month ago.
As you can see in the chart below, even with the single biggest crash in home sales ever recorded in history in 2022, total inventory data is still far from the historically normal levels between 2-2.5 million.
NAR total active inventory going back to 1982:
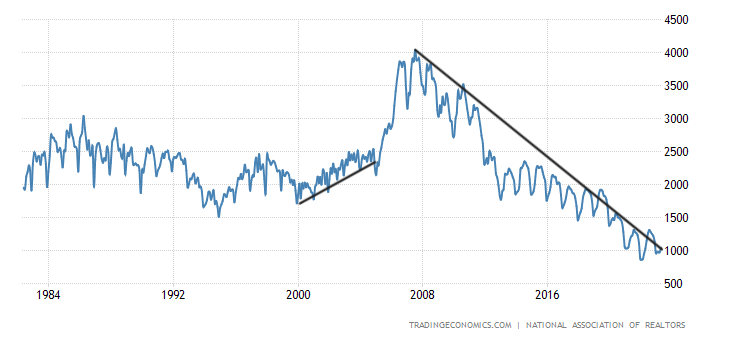
The existing home sales report surprised me on the demand side just a tad. However, the key for me is that the days on market data line turned housing into a savagely unhealthy housing market. The median sales price data fell year over year, which I love to see, but many people don’t put too much weight on median sales prices when the monthly data has firmed up with price increases.
If there isn’t a big scream about the decline in the year-over-year pricing, it’s more related to the prices firming up in all the monthly price indexes that aren’t tied to median sales prices.
NAR Research: The median existing-home price for all housing types in May was $396,100, a decline of 3.1% from May 2022 ($408,600). Prices grew in the Northeast and Midwest but fell in the South and West.
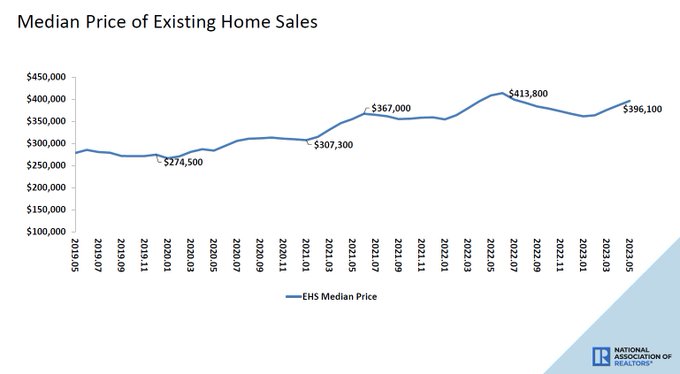
I publish the Housing Market Tracker every week which looks at the state of the inventory data so you have an idea of what is going on in almost real time — way before the monthly sales reports come in. This is important because the housing market dynamics shifted from a market that was crashing in demand with inventory rising, to a market with stable demand.
In contrast, inventory growth was so slow this year that we see negative year-over-year prints already in the NAR data. We picked up on this change on Nov. 9, 2022, and now that we are in June of 2023, the data confirms what we were tracking back then.
I looked at the housing market recession over the whole last year on this podcast and it’s ironic that we have traveled all the way back to a savagely unhealthy housing market.
Source link
In acquisition mode, Planet closes a $10B MSR deal
Connecticut-based lender and servicer Planet Home Lending announced on Thursday a deal that boosts its servicing portfolio, which the company claims is already above the $90 billion mark.
Planet has acquired a $10 billion mortgage servicing rights (MSR) bulk of Ginnie Mae loans from Village Capital & Investment LLC. and anticipated that it will continue bidding for MSRs in the second half of the year, engaging in bulk and co-issue transactions.
The deal with Village consists of 45,000 home loans securitized by Ginnie Mae. To understand the profile of the loans, Nevada-based mortgage banking company Village moved its focus to the Federal Housing Administration (FHA) Streamline Refinance program in 2011, per its website. The company claims it keeps costs low and uses targeted marketing techniques to pass savings to its borrowers through lower rates.
The transaction adds billions in servicing rights to a growing servicing company.
Planet was the 29th largest servicer in the country in the first quarter of 2023, with a $68.5 billion owned mortgage servicing portfolio, according to Inside Mortgage Finance (IMF) estimates. The volume in Q1 2023 was 68.3% higher than in the same period last year, the data shows.
However, Planet claims its servicing portfolio stood at $94 billion as of June 2023, and the deal with Village increases its MSR book by 10.6%. In early May, the company launched a commercial servicing division led by James DePalma and Janina Woods.
Planet was very active in MSR deals in the first half of 2023.
“We bought $12.5 billion in MSRs [the Village deal is included]. And in some of the larger deals, there was a fight against other bidders. Very competitive,” Michael Dubeck, CEO and president of Planet Financial Group, parent of Planet Home Lending, told HousingWire during an interview in mid-May. “A big acquisition was settled in April. And we probably did six smaller ones in February, March, and April,” Dubeck added.
According to Dubeck, Planet remains a “liquidity provider to mid- and smaller-tier issuers, providing competitive prices to sellers. In May, Planet closed a $150 million increase to its conventional MSR facility because, “Naturally, companies need bigger lines as they grow,” Dubeck said.
Industry observers said 2023 will be a “bull year” for MSR trading, with assets on lower-rate legacy loans dominating the market and a robust demand.
HousingWire reported that Rocket Mortgage sold about $20 billion in MSRs to JPMorgan Chase in April, following a decline in its servicing book in the first quarter of 2023, amid a challenging operating environment.
Wells Fargo also put an MSR portfolio worth roughly $50 billion up for auction and Mr. Cooper won this deal, sources told HousingWire. Mr. Cooper will inherit Home Point Capital’s $84 billion servicing portfolio as part of its acquisition of the company for $324 million in cash.
Source link