
Affordability slows home sales, hints at future home price declines
Mortgage rates peaked at 7.5% a couple weeks ago and are staying stubbornly high. Rising mortgage rates mean rising inventory as home buyer demand slows quickly. But home prices are staying pretty stable even though we can measure a slowdown in the number of homes getting offers.
Most years, available inventory of unsold homes on the market peaks in August. This year inventory is still climbing. Last year at this time, mortgage rates began to spike dramatically from under 6% to 7.5% in a few weeks. This caused inventory to rise dramatically late into October. The change in rates this year isn’t as dramatic as the change last year, so the change in inventory isn’t as dramatic either. Last year, the change in mortgage rates was rapid enough to drive home sales prices down.
There’s no getting around the fact that sales are slow, demand is held back because the cost of money is so much higher than it has been recently. It’s notable that home sales prices are not yet declining rapidly like they did last fall. But there are some new hints of weakness in future home sales prices.
Available inventory rose
Available inventory of unsold single family homes rose more than 1% again this week to 509,000 homes. Supply of homes on the market does not appear to have reached the peak for 2023. Last year at this time, inventory appeared to have already peaked, but the number of homes on the market jumped again along with mortgage rates later in September.
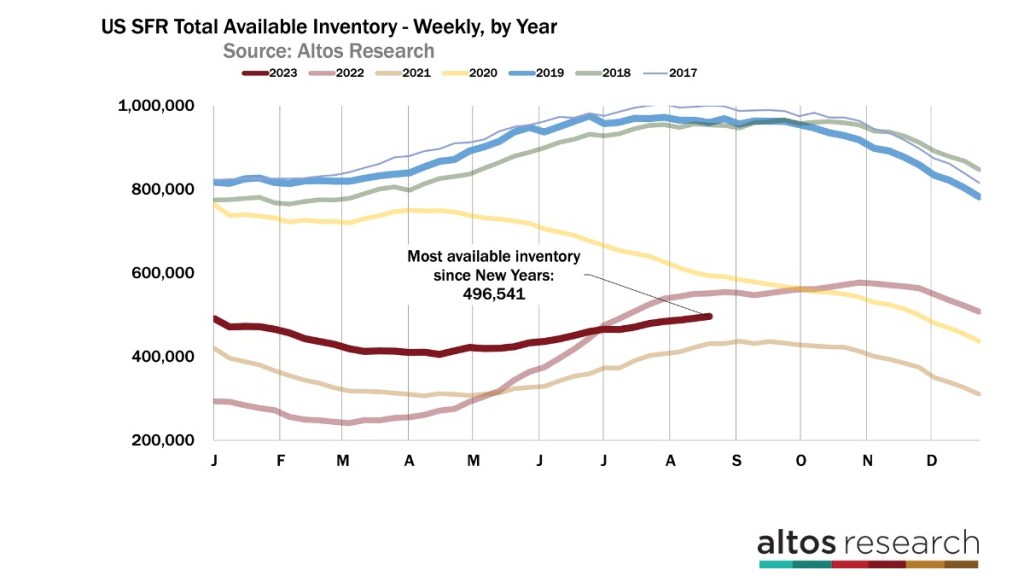
In this chart (above) you can see the comparison. The dark red line is on a steady climb each week. That’s this year. Mortgage rates have been rising, making homes more expensive to buyers and obviously slowing demand. Less demand means fewer purchases and inventory builds. There are 8% fewer homes on the market now than last year at this time. My guess is that later in September, mortgage rates ease down — maybe even under 7% — and inventory starts declining for the end of the year. Contrast that to last year, the light red line, when inventory kept climbing until rates finally peaked in November 2022.
In this chart (above) each line is a year’s curve of available inventory of unsold homes. Notice how each year inventory generally peaks in August. This is an effective illustration of the impact this year’s higher mortgage rates are having on home buyer demand. Inventory could still keep building for two more months if mortgage rates jump again.
There are only 358,000 single family homes in contract pending now. That’s 11% fewer than last year. The rate of sales picked up a bit last week before the Labor Day holiday. Though home sales are still running 7-10% lower than last year. This moment last year was right at the cusp of a dramatic slowdown both in prices and in purchase volume.
It could be that we finish September with home sales at a faster pace than last year. However, I’ve been looking for that change for several months and it’s been elusive. For a while this year it seemed like home sales would finish 2023 with more than 2022, and that hasn’t materialized.
We saw 64,000 newly pending contracts last week for single family home sales which is 7% fewer than last year. This week is a holiday week so new sales will tick down win next week’s data. So we have 11% fewer total contracts but only 7% fewer new contracts. Just slightly closing the gap from last year.
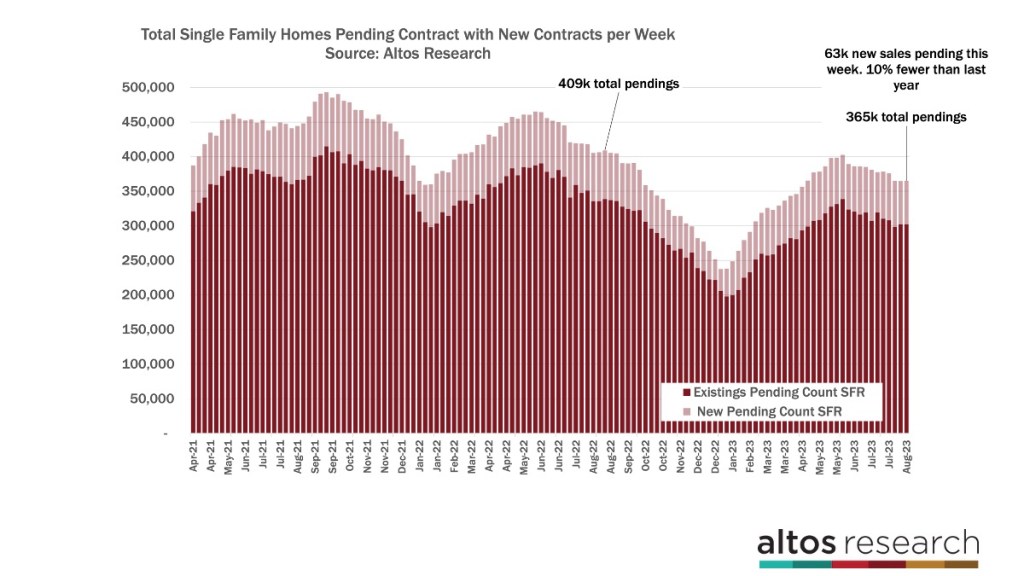
In the chart above, each bar is the total number of home sales in contract. The taller the bar the more sales are in process in a given week. The light portion of the bar are the new contracts that week. Last year the sales rate slowed dramatically after mid September. See how the light portion of the bar shrinks each week. This week the slowdown is much more gradual, much more like normal seasonality.
Price cuts climb
Meanwhile this autumn’s slowing home buyer demand is showing up in price reductions too. The percent of the homes on the market that have taken a price cut climbed again this week to 36.2%. You can see how we now have more price reductions than any recent year except last year at this time.
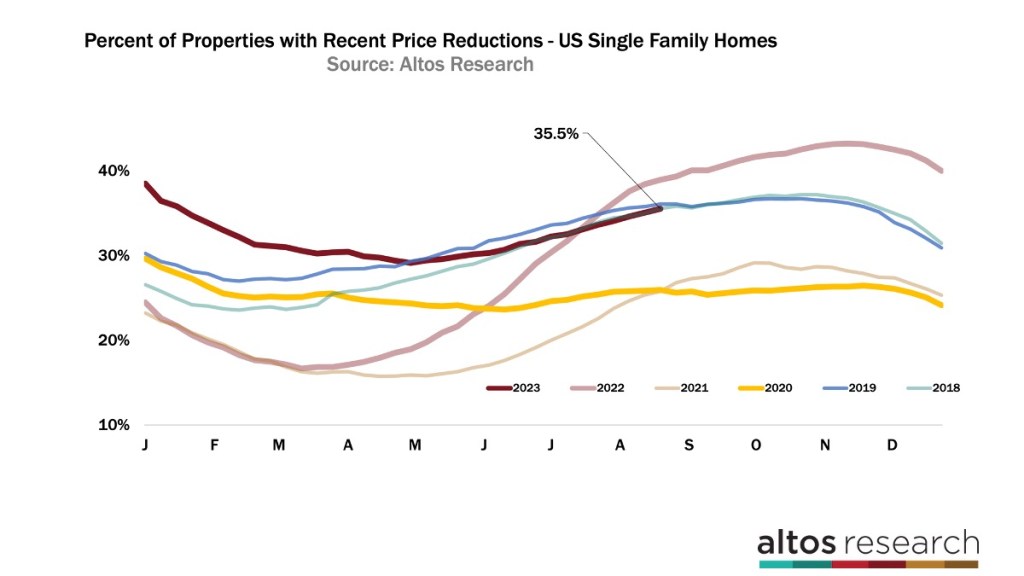
Think about price reductions as a leading indicator of future home sales prices. Tracking price reductions now is an excellent indicator or the organic levels of demand in the market. We can really see how buyer demand is sensitive to the rise over 7% mortgage interest. A home on the market now, doesn’t get offers, does a price reduction in September, gets an offer in October, which closes in November or December. We can see now the sales prices weakening several months in the future. This trend could change like it did the the first half of this year when rates were falling.
Consumers seem to react to changes in mortgage rates more specifically than to the absolute levels. When mortgage rates went from 7 to 7.5% last month, that’s why we have more inventory and more price cuts right now. When rates jump, fewer buyers make offers and therefore more sellers take a price cut to stimulate demand. That’s what we’re seeing now.
Last year, almost 40% of the homes had taken a price cut and that was showing us greater weakness in sales prices than we see now.
Home prices slightly ahead of last year at this time
In fact, home prices are running just slightly above last year at this time. The median price of single family homes in the US is $448,000 this week. Last year, homes were priced at $440,000 and adjusting down very quickly in the second half of the year. We saw that in the last slide with price reductions too.
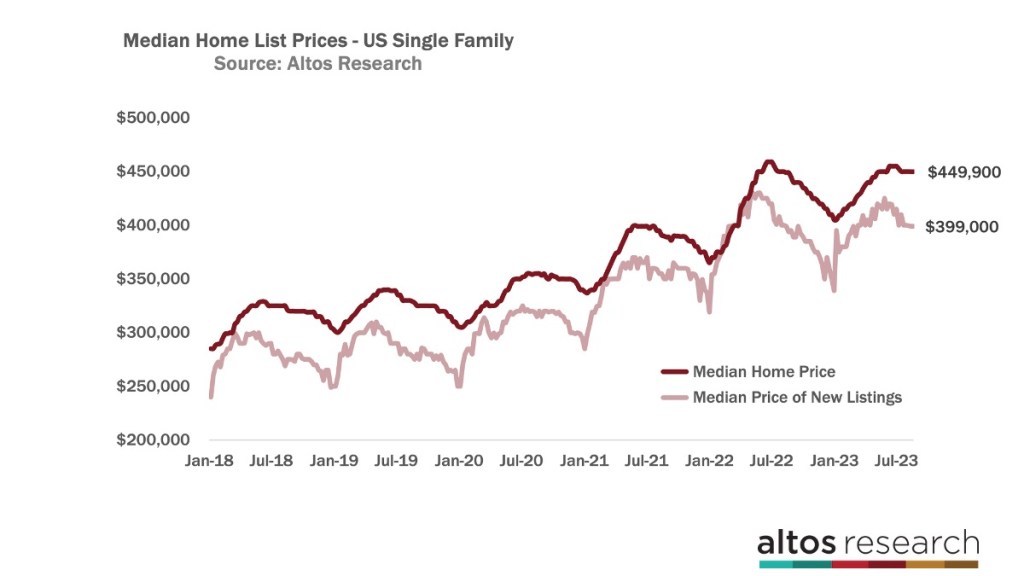
The median price of the newly listed homes is $395,000 now. The price of the newly listed cohort each week is also a leading indicator of future sales prices. Each week, sellers and listing agents have to price the new listings at a price point where they’ll sell. Last year when demand was dropping so quickly, so was the price of the new listings. That’s the light red line here. At the far right end of the light red line you can see that home prices are ticking down as happens in the third quarter each year, but prices are not falling as quickly as they did last year.
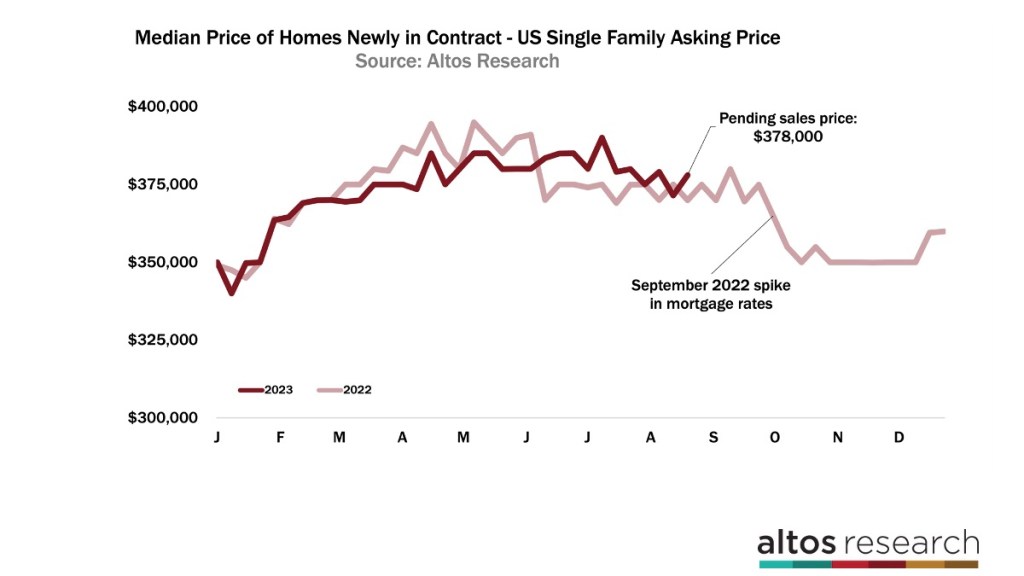
The median price of the homes in contract is $379,900. That’s unchanged from last week and about 1% higher than last year at this time. Over the last few weeks, homes prices have been ticking down. This is what you’d expect for late summer. Even though we can see the rate of transactions slowing and we can see the percent of homes with price reductions ticking up, the price of those getting offers isn’t not dropping dramatically like it did at several points last year. This illustrates my point that home buyers are more sensitive to the changes in rats than they are to the absolute levels of rates.
This year, at the far right end of the chart, the dark red line you can see that home sales prices peaked a couple months ago just before mortgage rates started climbing for the summer. See the gradual decline in the dark red line now. The median price of the homes newly in contract is $370,000. That’s basically unchanged from last week and from last year at this time.
Obviously, home buyers are sensitive to affordability, they’re also sensitive to weekly changes in affordability. Last year, the changes in mortgage interest rates were huge. In a few short weeks mortgage interest went from under 6% to 7.5%. That translated into a big drop in the median price of the newly contracted sales. Buyers that still chose to buy would only do so at significantly lower home price points. You can seem that drop in the middle of this chart. This year’s mortgage rates increase has been much more gradual and the subsequent price decline is much more gradual.
Home sales are in the contract stage for 30-45 days commonly so each week where the new sales prices tick down that adds up to the over all market in a few weeks.
There is so much signal in the active market that looking at the lagging closed sales prices don’t tell you.
Mike Simonsen is founder and president of Altos Research.
 :215-447-7209
 : deals(at)frankbuysphilly.com
