
2024 will be a better year for real estate recruiting: Relitix
After a multi-year decline in agent movement between brokerages, Relitix’s Agent Movement Index suggests that this trend may be reversing. The index shows that, measured on a trailing 12-month basis, the amount of agent recruitment bottomed out in October of 2023 and has begun to increase.
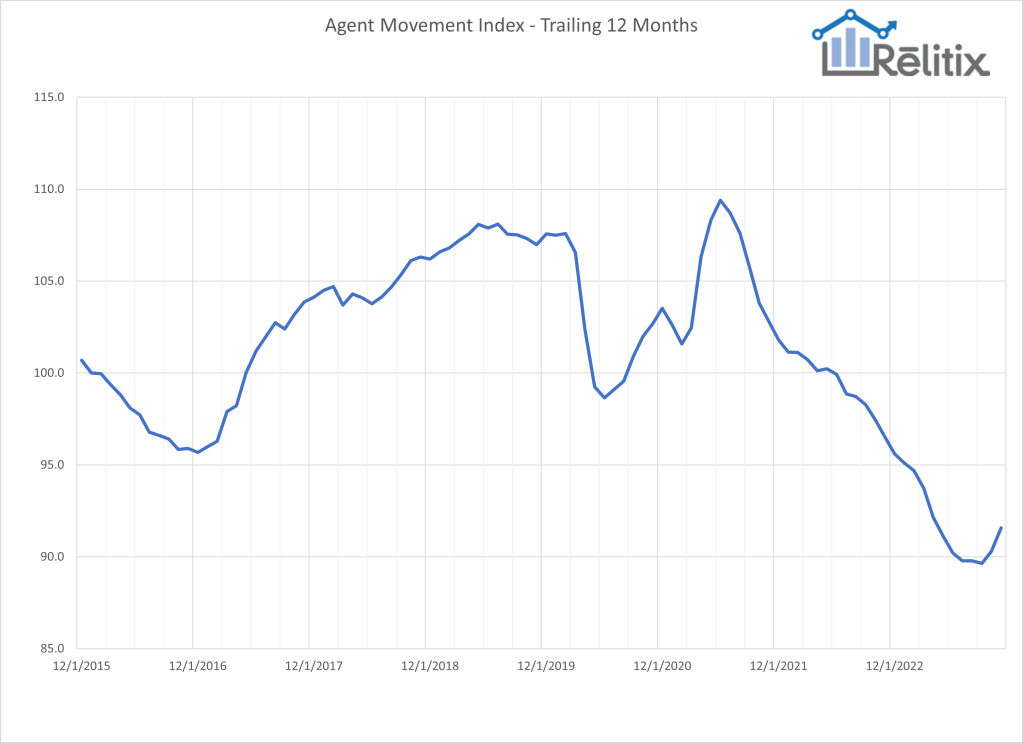
“After seeing less and less recruitment for nearly 30 months in a row, the tide may be turning,” said Relitix Founder and President Rob Keefe. “Keep in mind that we are still at a historically low level of movement and that the number of agents active in real estate has declined over the last year representing a smaller pool of recruitable agents. Nevertheless, 2024 may well end up being a better recruiting year than was 2023.”
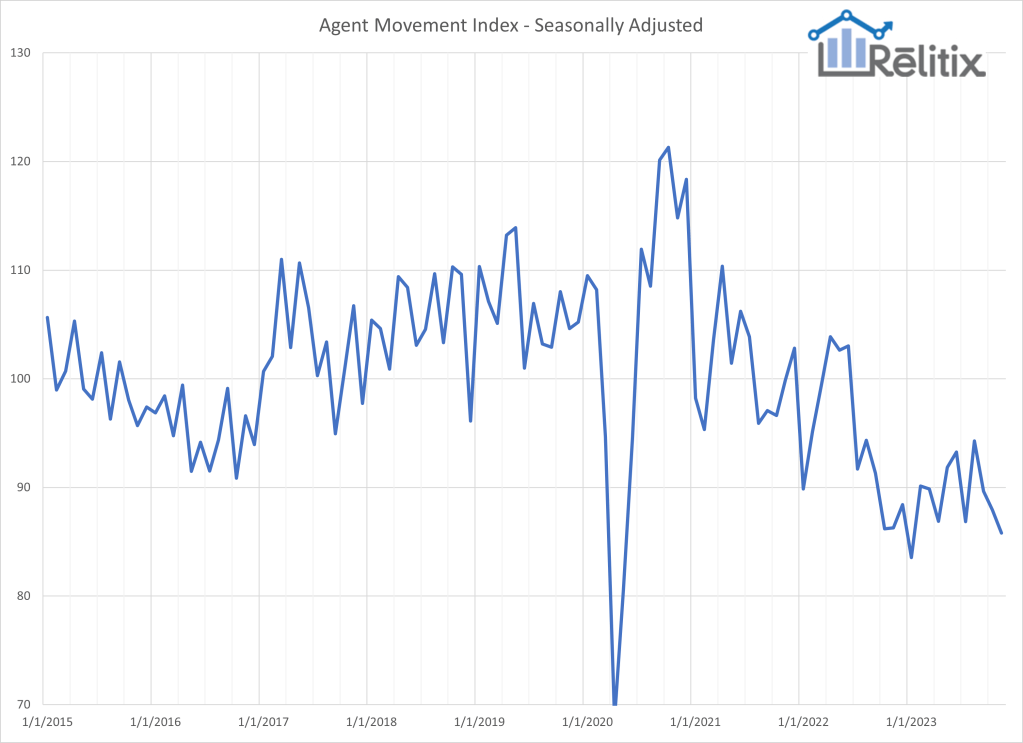
The monthly AMI value finished at 75.8 for November with a seasonally adjusted value of 85.8.
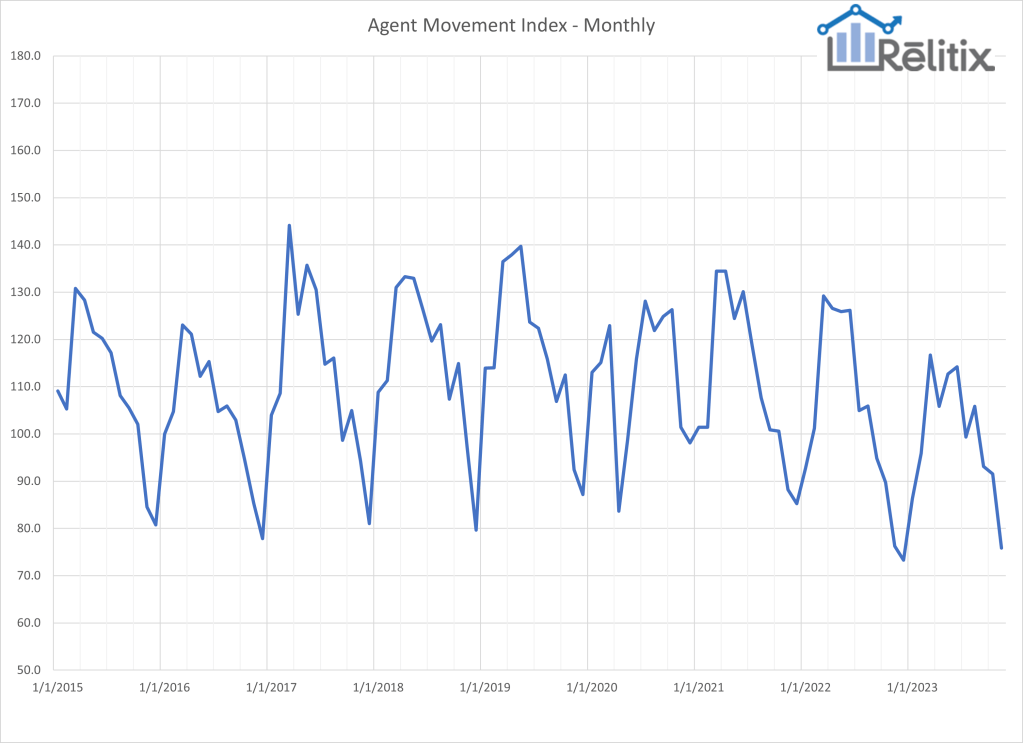
Trends in the relative movement of experienced real estate agents between brokerages are an important strategic consideration for brokerage and franchise leaders. The relative amount of movement fluctuates over time on a seasonal and long-term basis.
Methodology: The AMI is published monthly and features monthly and seasonally adjusted, and 12-month trailing values. The index is calculated using national-level data from a large sample of the nation’s most prominent MLS systems. The agent movement reflects the relative mobility of experienced agents between brokerages. The score is computed by estimating the number of agents who changed brokerages in a given month.
To be counted the agent must be a member of one of the analyzed MLS’s and change to a substantially different office name at a different address. M&A-driven activity and reflags are excluded as are new agents and agents who leave real estate. Efforts are made to exclude out of market agents and those which are MLS system artifacts.
The number of agents changing offices is divided by the number of agents active in the past 12 months in the analyzed market areas. This percentage is normalized to reflect a value of 100 at the level of movement in January 2016 (0.7313%). The seasonally adjusted value divides the monthly result by the average of the same month in prior years.
Analyzed MLS‘s represent over 800,000 members and include: ACTRIS, ARMLS, BAREIS, BeachesMLS, BrightMLS, Canopy, Charleston Trident, CRMLS, GAMLS, GlobalMLS, HAR, LVAR, Metrolist, MLSListings, MLSNow, MLSPIN, MRED, Northstar, NTREIS, NWMLS, OneKey, RealComp, REColorado, SEF, Stellar, Triad, Triangle, and UtahRealEstate.
Rob Keefe is founder of Relitix Data Science.

 :215-447-7209
 : deals(at)frankbuysphilly.com
